5 Boring Excel Functions That Are Secretly Brilliant
Published: Tue, 07/21/26
Updated: Fri, 07/24/26
These underrated functions that solve real business problems.
5 Boring Excel Functions That Are Secretly Brilliant
Hi ,
Some Excel functions have exciting names like XLOOKUP, FILTER, and LET. Others sound like they belong in a maths textbook.
Functions like ABS, SIGN, REPT, TRUNC, and CELL don't get much attention, but each one solves a surprisingly common problem. Better still, they're available in virtually every version of Excel, so you don't need Microsoft 365 to use them.
Let's look at five underrated Excel functions that can make your formulas smarter, your reports easier
to read, and your spreadsheets more reliable.
The ABS function returns the absolute value of a number by removing its plus or minus sign.
=ABS(number)
For example:
=ABS(-10)
returns:
10
On its own, that might not seem very exciting. But used in the right situation, ABS can prevent some seriously misleading calculations.
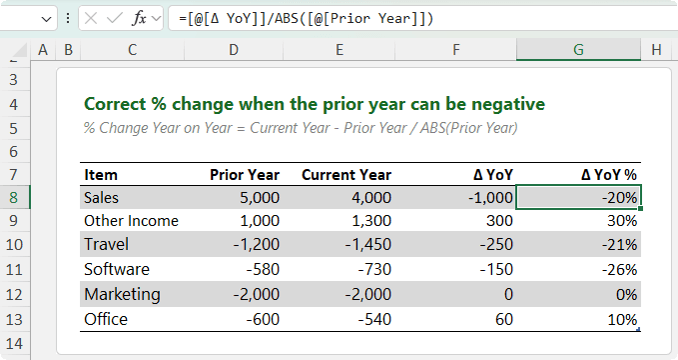
Example 1: Calculating Year-on-Year Percentage Change
A common formula for calculating percentage change is:
=(Current
Year-Prior Year)/Prior Year
This works perfectly for revenue figures that are always positive.
The problem comes when the prior-year figure is negative, such as expenses or losses.
Suppose travel costs increased from -$1,200 to
-$1,450.
The dollar change is:
-250
If you divide by the negative prior-year amount, Excel returns a positive percentage, suggesting performance improved when, in reality, costs increased.
The solution is to make the denominator positive:
=(Current Year-Prior Year)/ABS(Prior Year)
Now the percentage correctly reflects whether the change was favourable or adverse:
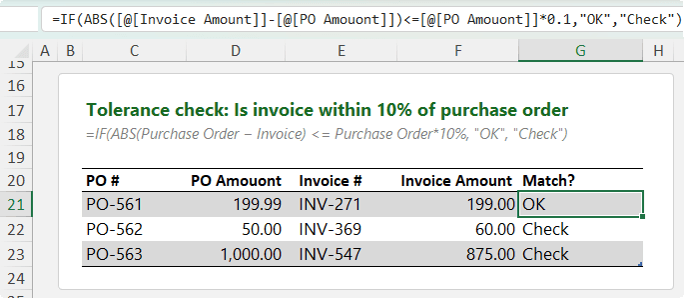
Example 2: Checking Invoice Tolerances
Imagine a business allows supplier invoices to vary by up to 10% from the purchase order amount.
You don't care whether the invoice is higher or lower. You only care about the size of the difference.
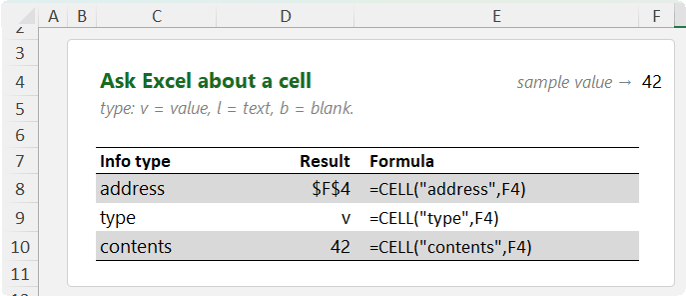
extracts the current sheet name from the workbook's full file path.
This is incredibly useful for:
• Monthly reports
• Dashboard tabs
• Duplicated worksheets
• Templates
Rename the sheet and the title updates automatically.
One
thing to remember: the workbook must be saved first. Until the file has a name, CELL("filename") has nothing to return.
Final Thoughts and Next Steps
None of these functions are particularly impressive on their own.
The magic happens when you know when to use them and how to combine them.
• ABS fixes misleading percentage calculations.
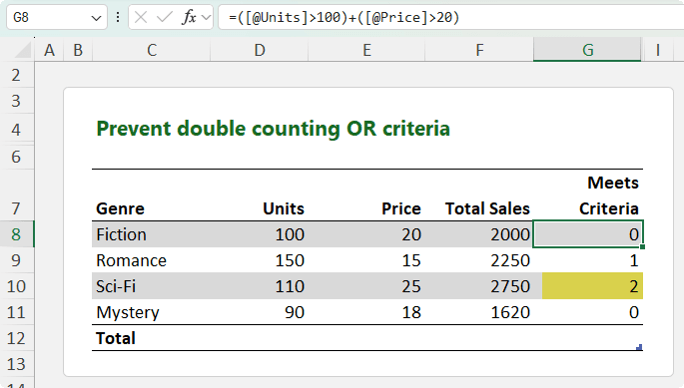
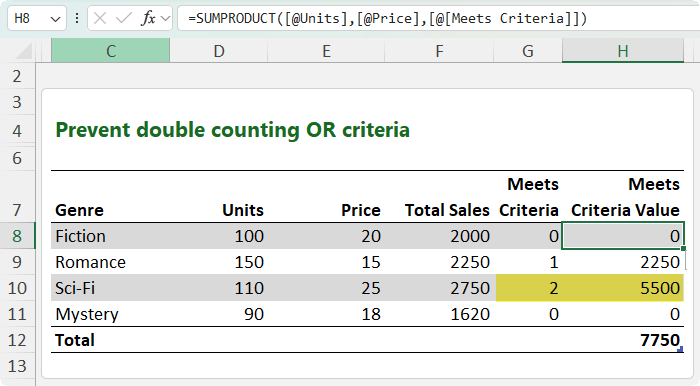
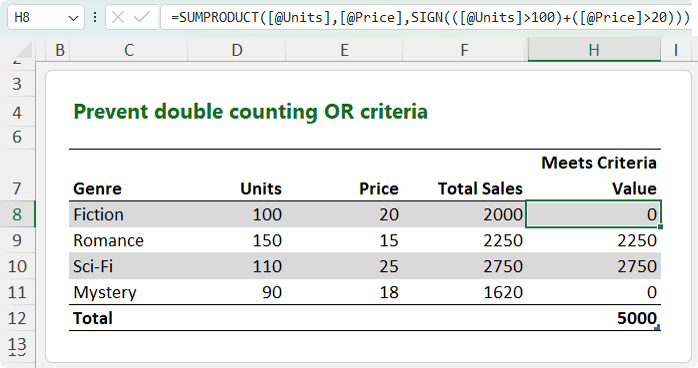
• SIGN prevents double counting in OR logic.
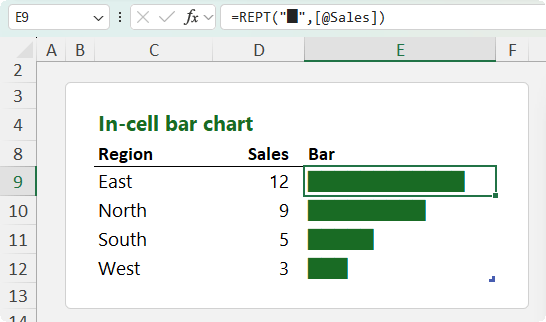
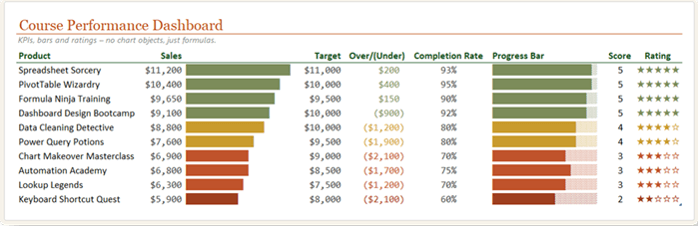
• REPT creates simple but effective visualisations.
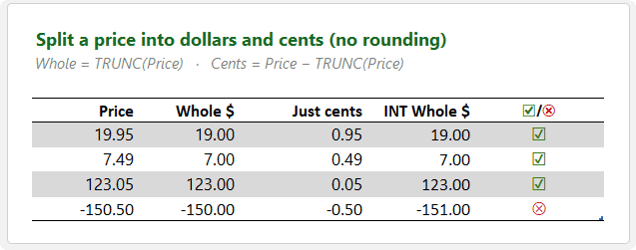
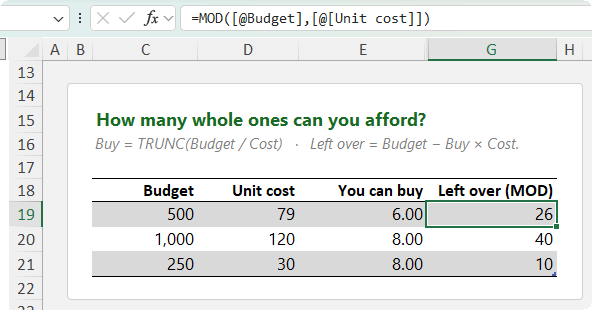
• TRUNC helps you work with whole quantities.
• CELL adds dynamic
information to your reports.
This is the real power of Excel. It isn't about knowing one giant formula. It's about having lots of small techniques you can combine to solve problems elegantly.
Want to get better at writing formulas like these? My Advanced Excel Formulas course will help you stop guessing and start building clean, confident formulas you can trust.
Want to sponsor our newsletters? Just reply to this email to get in touch with us.
Excel Dashboards
Dashboards provide insight, analysis and alerts by displaying key trends, comparisons and data in interactive reports. Filter data and change views to find the answers you need.
Microsoft’s leading business intelligence tool enables you to quickly develop stunning interactive dashboards. Embed Excel charts, Pivot Tables and data, then securely share to any device.
Ready to go beyond spreadsheets and start solving real business problems? Whether transitioning into data analysis or levelling up in your current role, this Excel Fast Track is your launchpad.
Automate repetitive tasks and build powerful Excel applications with Macros and VBA. Record macros, write VBA code, create custom functions and build user
forms — no prior programming experience required.
Get quickly up to speed with Excel’s functions. Covers the fundamentals for each
function and less-obvious advanced uses. The techniques that will really set you apart from the crowd.
Make huge efficiency gains using dynamic named ranges that automatically update formulas, Pivot
Tables and charts. Automate banded formatting, sorting, filtering and totals — all in under 1 hour.
Quickly build your own Pivot Tables with confidence. Covers ideal data layout,
formatting, aggregation, pivot charts, filters, slicers and much more — in the shortest time possible.
Automate the laborious task of gathering and cleaning data from almost any source. Load data into
Excel, Power Pivot or Power BI for analysis, report preparation or export.
Import millions of rows of data, create relationships between different data sources, and build
interactive reports. Transform huge volumes of data into meaningful information fast.
From zero to hero — confidently list ‘Advanced Excel Skills’ on your resume. Covers best workbook
design, advanced formulas, pivot tables, conditional formatting, macros and much more.
Supercharge your workflow with AI across Word, Excel, PowerPoint, Outlook and Teams. No tech
jargon — just practical skills that make your daily work easier, faster and smarter.
Quickly summarise and analyse large amounts of data with just a few clicks. Transform data
into meaningful information and create reports that are easy to update and change.
Choose one or any combination of the three. Learn the core Office tools every
professional needs — covering the skills that matter most in a modern workplace environment.
This email may contain affiliate links. This means I may earn a commission should you choose to make a purchase using my link. But we only promote courses we believe will benefit you.