Some of the most repeated Excel advice online is either outdated, incomplete,
or simply wrong.
You may have heard things like:
“Don’t use Tables, they’re slow.”
“Helper columns are amateur.”
“Never
format whole rows or columns.”
“Volatile functions will destroy workbook performance.”
The problem is that this advice often gets repeated without context. Over time, it can make you avoid Excel features that would actually make your work faster, cleaner, and easier to maintain.
So let’s bust 9 of the most common Excel myths and look at what really matters.
Excel Myth 1: Volatile functions make workbooks slow
Volatile functions are often blamed for slow Excel files.
Common volatile functions include:
• TODAY
• NOW
• OFFSET
• INDIRECT
• RAND
• RANDARRAY
• RANDBETWEEN
• CELL
• INFO
These functions recalculate whenever Excel recalculates, even if their inputs have not changed. That means they can affect performance.
But that does not mean every volatile formula is dangerous.
A few volatile formulas in a workbook are usually fine. For example, using NOW to show the current time is unlikely to cause a serious performance issue on its own.
The problem starts when volatile functions are used thousands of times, especially inside complex formulas or large calculation chains.
For example, a workbook with 10,000 rows of SUMPRODUCT formulas containing nested OFFSET functions can
become noticeably slow. Editing one cell can cause Excel to recalculate all those volatile formulas, even where the formulas do not directly depend on the edited cell.
The better rule is this:
Use volatile functions when they solve the problem well, but avoid
building large, repeated calculation chains around them.
A particularly common offender is INDIRECT. It can be useful in specific situations, but it is often overused. It can make formulas harder to audit, harder to
maintain, and more fragile when workbook structures change.
Someone has a slow file. The file contains Tables. Therefore, the Tables must be the problem.
That conclusion is usually too simplistic.
Excel Tables are one of the most useful features in Excel. They
automatically expand when new data is added, copy formulas down columns, make formulas easier to read with structured references, and provide a reliable source for PivotTables, charts, Power Query and formulas.
In a realistic business workbook with 50,000 rows and multiple columns, a Table can handle formula columns and lookup formulas comfortably, provided the formulas themselves are efficient.
The Table is usually
not the issue.
The real performance problem is more likely to be what is inside or around the Table, such as:
• Thousands of complex lookup formulas
• Nested IF formulas
• Volatile formulas
• Array formulas across large ranges
•
Excessive conditional formatting
• Formulas referencing unnecessarily large ranges
To be
fair, this myth has some history behind it. When Tables were first introduced, they could be slower with larger datasets. However, those performance issues were improved long ago, while the stigma remained.
So don’t blame the Table just because it is there.
Instead, check what Excel is being asked to
calculate.
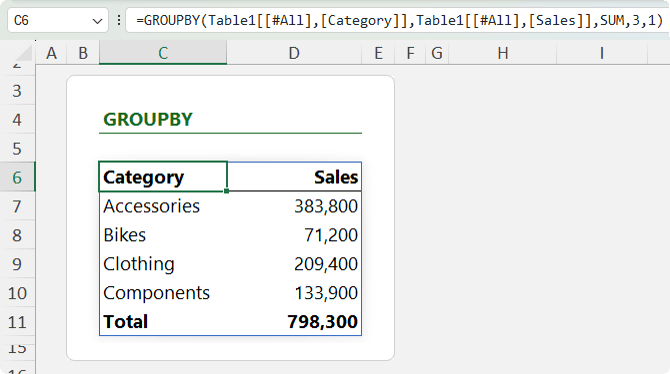
Dynamic array functions are fantastic. GROUPBY can summarise data by category:
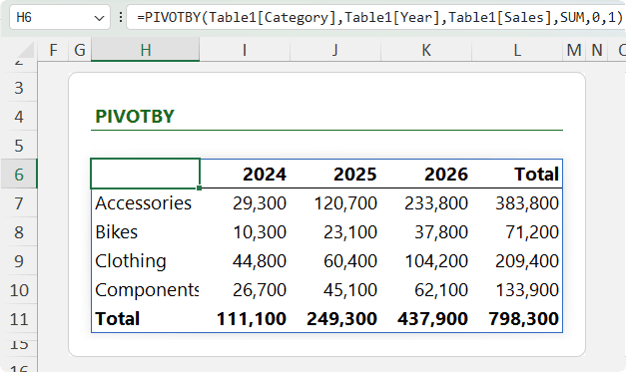
PIVOTBY can create cross-tab style reports:
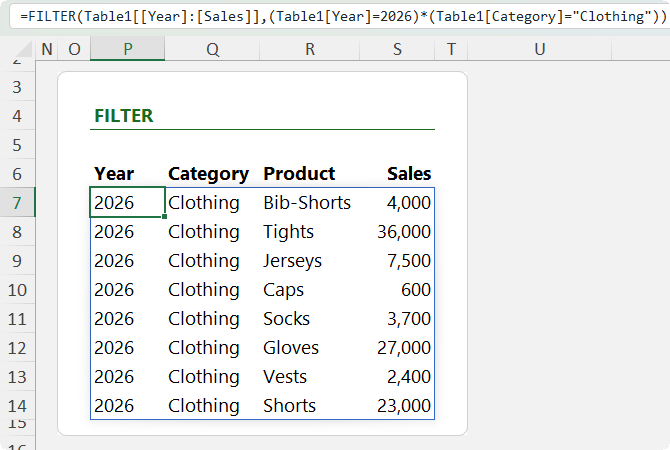
FILTER can return specific records based on criteria:
If you are building a custom formula-driven report with a specific layout, dynamic arrays can be an excellent solution.
But that does not make PivotTables redundant.
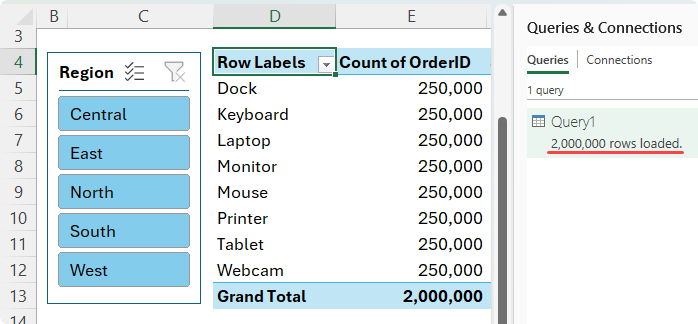
PivotTables are still one of the fastest ways to explore and summarise data. In just a few clicks, you
can:
• Summarise sales by category
• Split results by year
• Add product detail underneath
• Insert slicers
• Filter the report
• Drill down into a number
to see the records behind it
That last point is important. If you double-click a PivotTable value, Excel creates a new sheet showing the underlying records behind that result.
That is incredibly useful when you are still trying to understand the data.
Dynamic array formulas and PivotTables solve different problems.
Use dynamic arrays when you need a custom formula-driven report.
Use PivotTables when you need fast, flexible, interactive analysis.
Excel Myth 4: Excel can only handle small datasets
Excel worksheets have a hard limit.
A worksheet can contain 1,048,576 rows and 16,384 columns.
So yes, the grid has a limit.
But Excel as a tool is not limited to small datasets.
If you try to load millions of rows directly into a worksheet, you will hit the row limit. But you do not have to store large datasets in the worksheet grid.
The Data Model can store and analyse much larger datasets than the worksheet grid can hold. Once the data is loaded there, you can build PivotTables, charts, slicers and DAX
measures based on that data.
This completely changes how you should think about Excel and large datasets.
The worksheet is not always the destination for your data. Sometimes it is just the reporting layer.
For
large datasets, a better workflow is:
1. Use Power Query to connect to the
data.
2. Clean and transform the data.
3. Load it to the Data Model.
4. Analyse it with PivotTables, charts, slicers and DAX measures.
So the real limitation is not simply “Excel can only handle small datasets.”
The more accurate statement is:
The worksheet grid has a row limit, but Excel’s data tools can work with much larger datasets when you use Power Query and the Data Model.
Excel Myth 5: Avoid whole-column references in formulas
Whole-column references are another piece of Excel advice that gets repeated without enough context.
You may have been told never to use formulas like:
=SUM(Data!D:D)
or:
=COUNTIF(Data!D:D,">10000")
This advice comes from a real performance concern.
In older versions of Excel, worksheets had far fewer rows. Since Excel 2007, the worksheet grid has expanded to 1,048,576 rows. That means formulas that force Excel to evaluate an entire column can have a lot more cells to process.
But whole-column references are not automatically bad.
For simple functions like SUM, COUNT, COUNTIF, SUMIF and some SUMIFS formulas, Excel can often handle whole-column references efficiently because it recognises the used range in the column rather than blindly processing every row.
So formulas like these can be perfectly reasonable when the column is clean:
=SUM(Data!D:D)
=COUNTIF(Data!D:D,">10000")
But this kind of formula is different:
=SUMPRODUCT(Data!D:D,Data!E:E)
SUMPRODUCT processes the arrays you give it. With whole-column references, you are asking it to process over a million rows in each column.
If you repeat formulas like that across lots of cells, the calculation load can add up very quickly.
Whole-column references can also create accuracy risks
when the column contains headings, notes, totals, old data, or future entries that should not be included.
The better rule is:
Whole-column references are fine for simple formulas where the column is clean and the function handles the range efficiently. For heavier formulas like SUMPRODUCT, array formulas,
complex conditional logic, or formulas repeated many times, use an Excel Table or a properly bounded range instead.
Want to get better at advanced Excel formulas?
If this kind of formula
nuance is exactly what you want to get better at, my Advanced Excel Formulas course is designed for you.
It covers lookup functions, dynamic arrays, logical formulas, error handling, text functions, named ranges
and more, with practice files so you can apply what you learn straight away.
You also get support from me when you need help.
Excel Myth 6: Never format whole rows or columns because it
will make your file huge
This myth sounds logical.
The idea is that if you format an entire row, column, or worksheet, Excel must store formatting information for every single cell, making the file huge.
But that
is not always how it works.
Formatting a large range of individual cells can create a lot of stored formatting information, especially if the formatting is inconsistent or fragmented.
However, when you apply formatting at the row or column level, Excel can store that formatting more efficiently because it
applies to the row or column as a unit.
Here is an interesting example.
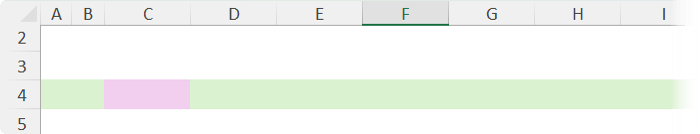
If you format an entire row green, then format one cell in that row purple, it looks like the purple formatting has replaced the green formatting in that cell:
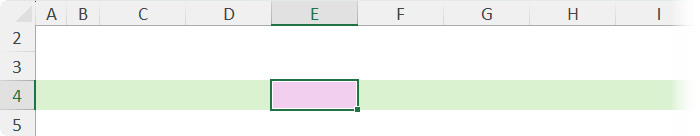
But if you cut that purple cell away and paste it somewhere else, the original green formatting underneath is still there:
That shows Excel is layering the formatting. The row-level formatting remains underneath, while the cell-level formatting sits on top.
The takeaway is this:
Consistent whole-row or whole-column formatting is fine.
What you want to avoid is fragmented formatting across large cell ranges far outside the actual data.
That kind of messy formatting can bloat files and cause unexpected behaviour, especially
if it extends far beyond the used range.
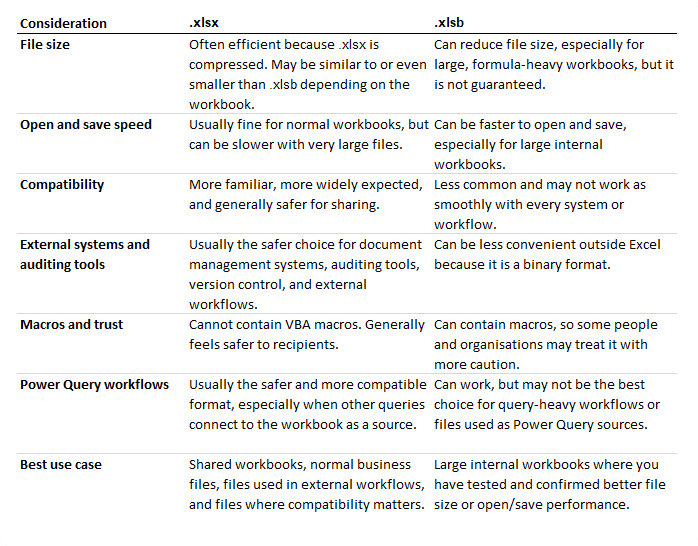
Excel Myth 7: Saving as .xlsb always makes a file better
Excel Binary Workbook files, or .xlsb files, are often recommended as a quick fix for
large or slow workbooks.
And sometimes, they help.
An .xlsb file can reduce file size and improve open and save speed, especially with large, formula-heavy workbooks.
But the key word is sometimes.
The result depends on what is inside the file.
Some workbooks compress very well as .xlsx files. Others benefit more from the binary format. In some cases, an .xlsb version can even be slightly larger than the .xlsx version.
So file size alone is not enough reason to automatically save everything as .xlsb.
Here is how the formats compare.
The better rule is:
Use .xlsb when you have a large internal workbook and you have tested that it genuinely
improves file size or performance.
For most shared workbooks, .xlsx is still the safer default.
Excel Myth 8: Helper columns are amateur
Helper columns are sometimes dismissed as a beginner technique.
But that view can lead to worse workbooks.
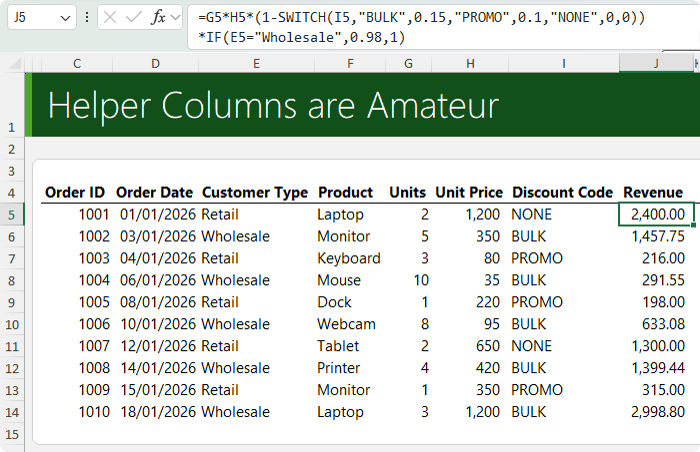
A single giant formula can look impressive, but it can also be harder to read, harder to debug, harder to audit and easier to break:
Splitting logic into helper columns can make a workbook clearer and more maintainable:
Helper columns are useful because they let you:
• Test each step of the calculation
• See intermediate results
• Reuse logic instead of repeating it
• Make formulas easier for other people to understand
• Reduce the risk of errors
• Improve performance in some cases
Performance can improve because Excel can calculate intermediate results once, rather than repeating the same logic inside multiple formulas.
For example, instead of writing one enormous formula that cleans text, checks a condition, performs a lookup, calculates a result and handles errors all in one cell, you can split those steps into separate
columns.
That makes it easier to see where the logic fails if the answer is wrong.
Helper columns are not amateur.
They are often the professional choice because they make workbooks clearer, faster and easier to
maintain.
Excel Myth 9: You need VBA to automate Excel
For many years, VBA was the main automation tool in Excel.
If you wanted to automate a task, you recorded a macro or wrote VBA code.
VBA is still powerful and still useful. It is especially valuable when you need:
• Buttons
• Custom workbook behaviour
• Event-driven actions
• User forms
• Code that interacts directly with the Excel interface
• Actions that respond when someone changes a
cell
• Processes that create PDFs, clear forms, or move data between sheets
But automation in Excel is much broader than VBA
now.
If you want a button that clears a form, creates a PDF, moves data to
another sheet, opens a custom user form, or responds when someone changes a cell, VBA may be the right tool.
VBA is still excellent for workbook-specific automation that needs to interact with the Excel interface.
If the task needs to run in Excel online, connect to other apps, or trigger a workflow in the cloud, Office Scripts or Power Automate may be more appropriate.
These tools are better suited to modern cloud-based workflows, especially where Excel needs to interact with email, SharePoint, Teams, OneDrive, forms, approvals, or scheduled processes.
The myth comes from treating automation as one thing.
But
automation can mean many different things, and each job has a different best tool.
The lesson behind these Excel myths
Most Excel myths start with a small piece of truth.
Volatile functions can slow workbooks down.
Tables may be present in slow files.
Whole-column references can be inefficient in certain formulas.
Formatting large areas can bloat workbooks.
.xlsb can improve file size or performance in some cases.
VBA is powerful.
But the problem is when these ideas turn into blanket rules.
Excel is more nuanced than that.
The better approach is to ask:
• What is Excel calculating?
• How many times is it calculating it?
• Is the range larger than necessary?
• Is the workbook being shared with others?
• Is the feature actually causing the problem, or is it just present in the file?
• Is there a better tool for this specific job?
That mindset will help you build faster, cleaner and more reliable Excel workbooks.
Want to sponsor our newsletters? Just reply to this email to get in touch with
us.
This email may contain affiliate links. This means I may earn a commission should you choose to make a purchase using my link. But we only promote courses we believe will benefit you.