Why Use Excel for Inventory Management?
Many businesses jump straight to expensive software, but Excel offers surprising advantages:
- Flexibility: Customise it to suit your products and processes.
- Cost-effective: No subscription fees.
- Automation-ready: Use formulas, PivotTables, and conditional formatting for instant updates.
- Scalable: Track stock across multiple stores,
suppliers, or product categories.
This guide walks you step by step through building your own system, so you can take full control of your inventory.
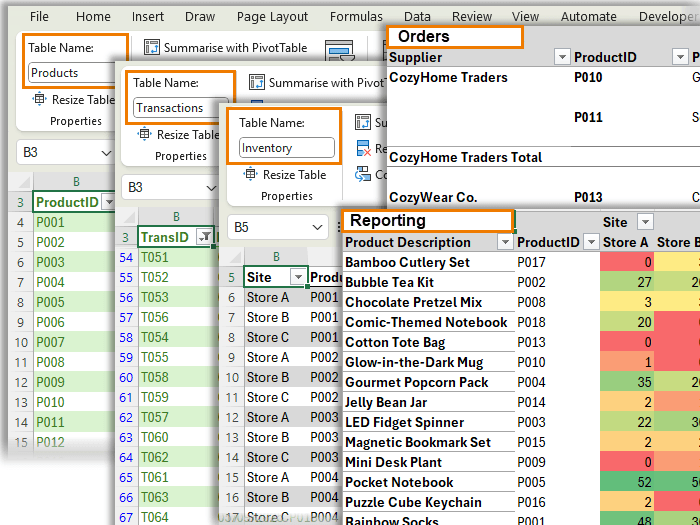
Overview of the Excel Inventory System
Your workbook will include five interconnected
sheets:
- Products Sheet – Your catalogue of everything you sell (name, category, cost, supplier, reorder level).
- Transactions Sheet – Every stock movement, both sales and receipts.
- Inventory Sheet – Current stock levels by site.
- Order Sheet – Automatic reorder list grouped by supplier.
- Reports Sheet – Insights on stock quantities and
values.
Together, they form a lightweight but powerful system: transactions feed inventory, inventory drives orders, and reports give you instant insights.
Step 1: Create the Products Sheet
The Products sheet is your master
list. Include columns like:
- Product ID
- Product Name
- Category
- Cost per Unit
- Reorder Level
- Supplier
💡 Tip: Format the range as an Excel Table and name it Products. Define a named range (ProductList) for Product IDs. We’ll be using this name in a drop-down list to ensure accuracy when referencing products in other sheets.

Step 2: Build the Transactions Sheet
Every stock movement (sale or delivery) is recorded here. Key columns
include:
- Transaction ID (sales invoice number or purchase invoice number).
- Date
- Product ID
- Site (Store A, B, etc.)
- Quantity (positive for receipts, negative for sales)
- Type (e.g., Sale, Receipt, Opening Stock)
Format this as a Table named Transactions. Use data validation drop-downs linked to your ProductList name to avoid errors.
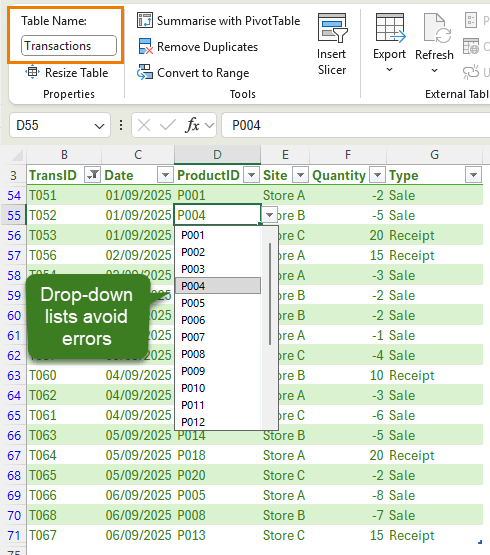
👉 This sheet becomes your audit trail - if stock looks off, you can trace every movement.
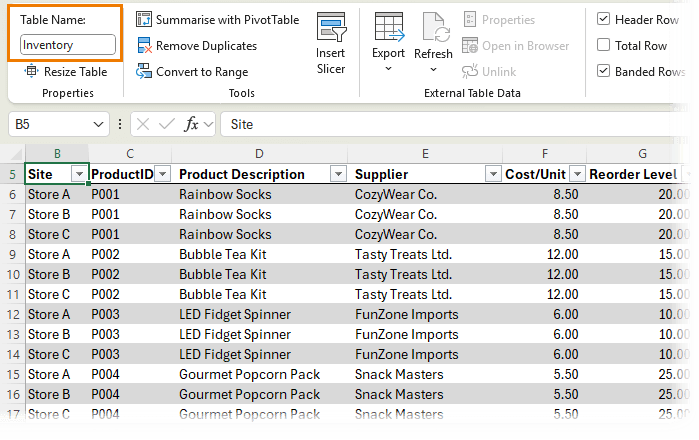
Step 3: Set Up the Inventory Sheet
This
sheet answers the big question: How much stock do I have right now, and where is it?
Columns include:
- Site
- Product ID
- Product Description
- Supplier
- Cost per Unit
- Reorder Level
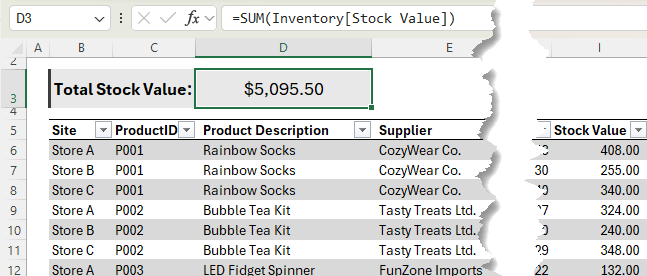
- Quantity on Hand (calculated with SUMIFS)
- Stock Value (Cost/Unit * QuantityOnHand)
- Reorder (Yes/No flag)
- Order Date
Add a headline figure at the top:
=SUM(Inventory[Stock Value])
This gives you the total stock value at a glance.
Step 4: Automate the Order Sheet
When stock levels fall below the reorder threshold,
the Order sheet uses a PivotTable to summarise what needs to be ordered:
- Rows: Supplier, Product ID, Product Name
- Columns: Site
- Values: Reorder Level
- Filters: Reorder = Yes, Order Date
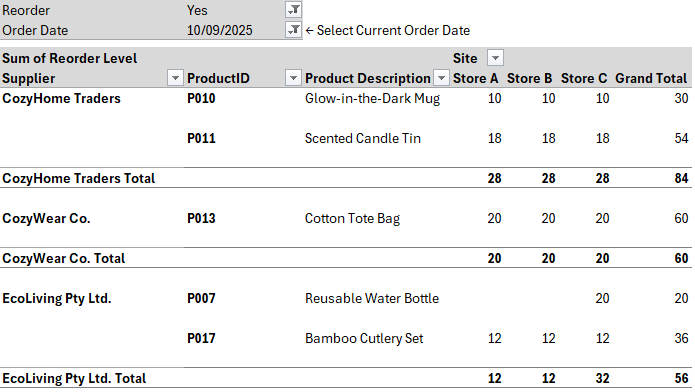
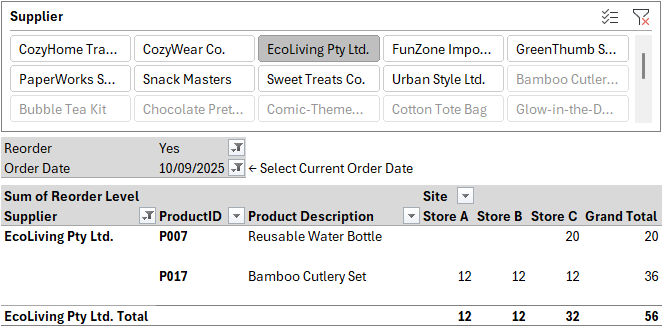
Add a Supplier slicer for quick filtering. The result? A ready-made purchase order list:
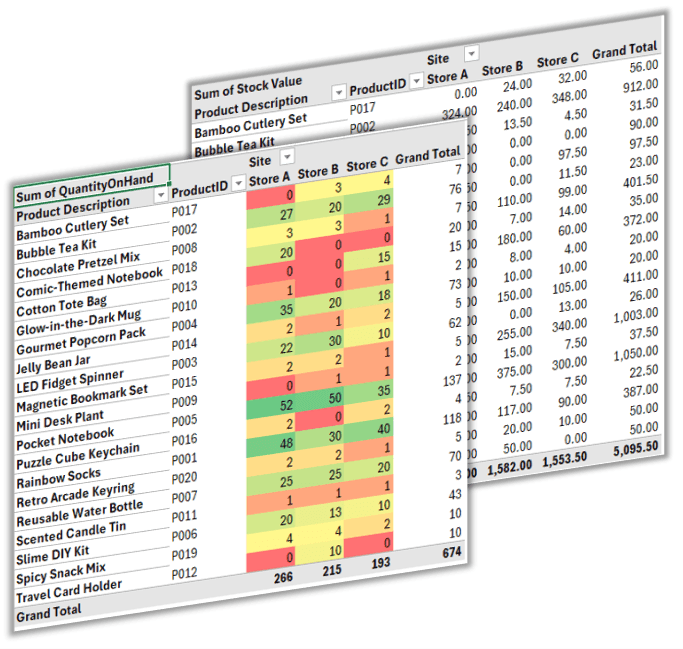
Step 5: Generate Reports
Finally, the Reports sheet uses PivotTables to show:
- Stock quantities by site
- Stock value by supplier or category
- Conditional formatting heatmaps for quick insights
These reports give you real-time visibility of what’s in stock and where
shortages are emerging.
Why This System Works
- Accuracy: Centralised product list ensures consistent data.
- Automation: Transactions update inventory and orders automatically.
- Scalability: Works for one store or many locations.
- Simplicity: No coding or external tools required.
This system turns Excel into a reliable inventory hub for small and medium businesses.
Next Steps: Take Excel Even Further
If you enjoyed building this inventory system, you’ll love my Excel Expert course. You’ll learn advanced techniques to build smart, automated solutions that save you hours every week.
👉 Explore the Excel Expert Course here.