Why “Proficient in Excel” Is Costing You Money
Most resumes include phrases like:
- Proficient in Excel
- Experience with VLOOKUP and PivotTables
- Strong spreadsheet
skills
The problem is that these phrases describe baseline familiarity, not expertise. Almost every candidate uses them, which means they do nothing to differentiate you.
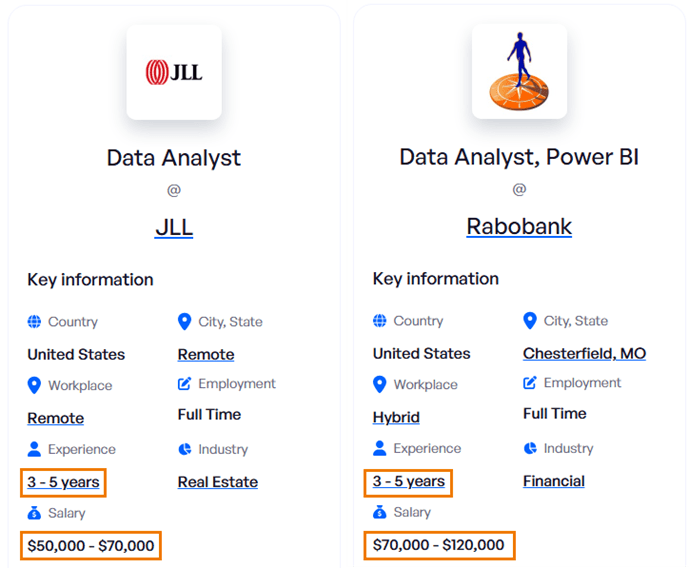
When your skills look identical to everyone else’s, your salary range usually is
too.
Modern data roles require far more than static spreadsheets and basic formulas. Employers are looking for professionals who can:
- Automate manual reporting
- Work efficiently with large
datasets
- Build interactive dashboards for decision-makers
- Combine data like a database rather than copy-pasting files
- Turn raw data into clear business insights
These
capabilities directly impact efficiency, accuracy, and decision-making. That is why they command higher compensation.
Skill 1: Power Query for Automation and Data Preparation
Many analysts still spend hours each week copying files, cleaning data manually, and repeating the same steps month after month. Power Query eliminates this entirely.
Instead of repeating tasks, you build a workflow once and refresh it with a single click.
Power Query is commonly used for:
- Importing CSVs and system exports
- Cleaning and standardising messy data
- Combining files from multiple folders
- Fixing date formats, text issues, and
column structures
- Merging tables without formulas
This turns manual work into a repeatable data pipeline.
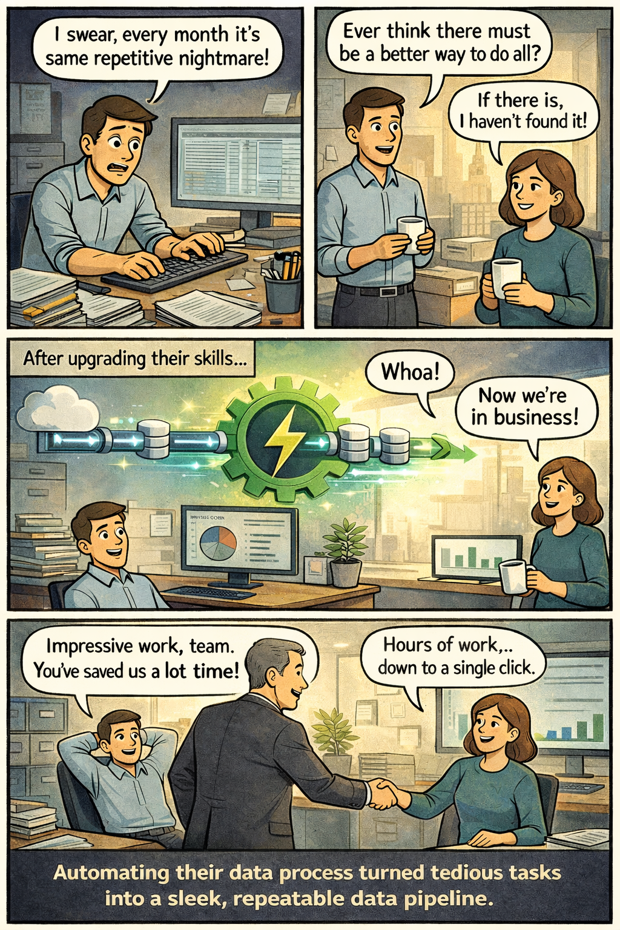
If you reduce a multi-hour monthly process to a one-click refresh, that is not basic Excel usage. That is automation and process improvement.
How to list Power Query on your resume:
❌ Do not write: “Used Power Query”
Instead, use this structure: Action + Skill + Context + Result
Example:
Automated monthly financial reporting using Power Query, consolidating data from 8 sources and reducing processing time from 12 hours to 30 minutes, a 96 percent time savings.
This tells a complete story about what you did, how you did it, and why it mattered.
Skill 2: Power Pivot and DAX for Large-Scale Analysis
Power Pivot fundamentally
changes how Excel works. It allows you to analyse millions of rows, connect multiple tables like a relational database, and build models that update with a single refresh.
DAX, the calculation language behind Power Pivot, enables advanced analytics that standard PivotTables cannot handle.
With these tools, you can quickly
answer questions like:
- What is our average revenue per customer by region and month?
- Which products generate the highest profit margin?
- How did sales change compared to the same period last year?
- Which customer segment is driving growth?
Without Power Pivot, these questions often require multiple files and complex formulas. With Power Pivot and DAX, they become fast, reliable, and scalable.
How to list Power
Pivot and DAX on your resume:
❌ Do not write: “Created PivotTables for reports”
Instead:
Built Power Pivot data models analysing over 2 million records across multiple sources,
enabling real-time profitability reporting and reducing monthly reporting time by 80 percent.
Or:
Created DAX measures for customer lifetime value and year-over-year performance, improving accuracy of executive reporting and accelerating
decision-making.
Skill 3: Interactive Dashboards That Drive Decisions
Business leaders do not want spreadsheets filled with numbers. They want to understand what is happening quickly and clearly.
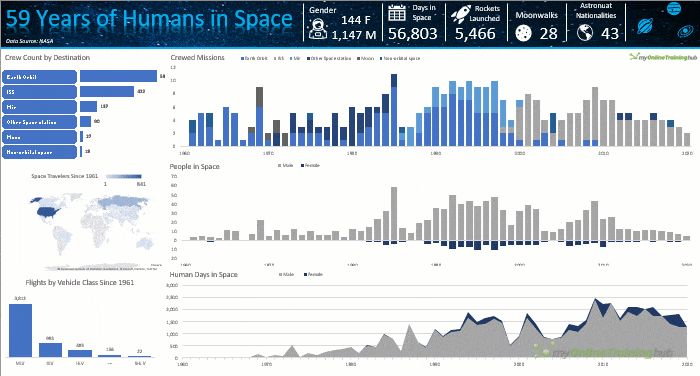
Excel Dashboards turn data into decisions by allowing leaders to:
- See KPIs at a glance
- Explore trends using filters and slicers
- Drill into regions, products, or time periods
- Identify what is working and what
is not
When executives rely on your dashboards to steer the business, your work becomes visible and valuable.
How to list dashboard skills on your resume:
❌ Do not
write: “Made charts in Excel”
Instead:
Designed interactive executive dashboards with real-time KPI tracking, reducing management reporting requests by 70 percent and enabling data-driven decision-making.
Or:
Built a sales performance dashboard with drill-down capabilities across 15 metrics, eliminating 8 hours of weekly manual reporting.
Skill 4: Financial Modelling for Strategic Planning
Financial modelling is where Excel becomes a decision-making engine.
It involves forecasting revenue, expenses, cash flow, and profitability, and testing scenarios so businesses can plan with
confidence.
Typical questions answered through financial models include:
- What happens to cash flow if we hire additional staff?
- How do rising costs affect profitability next quarter?
- Which pricing strategy delivers the highest margin?
- How many units must we sell to break even?
These decisions involve real money, often at a large scale. That is why roles requiring financial modelling sit at the higher end of the salary range.
How to list financial modelling on your resume:
❌ Do not write: “Created budgets and forecasts”
Instead:
Built three-year financial forecasting models with scenario analysis, supporting $5 million investment decisions and improving budget accuracy by 23 percent.
Or:
Developed
dynamic pricing models using Solver and Goal Seek, increasing annual revenue by $380,000.
Skill 5: Power BI for Business-Ready Analytics
While Excel remains essential, many organisations expect analysts to deliver insights through Power BI.
Power BI builds on the same Power Query and Power Pivot foundations, allowing you to:
- Connect to databases and cloud data sources
- Transform and model large datasets
- Build interactive dashboards for teams and
executives
- Share web-based reports with automatic refresh
This is where Excel skills evolve into full business intelligence capability. Analysts who can move seamlessly between Excel and Power BI are in high demand and are paid accordingly.
How to list Power BI on your resume:
❌ Do not write: “Used Power BI for reports”
Instead:
Developed Power BI dashboards serving over 200 users across five departments, providing real-time sales visibility and reducing ad-hoc reporting requests by 70 percent.
Or:
Built automated Power BI reporting
with daily refreshes, replacing manual Excel reports and saving 12 hours per week across the finance team.
The Most Efficient Way to Master These Skills
You do not need a data science degree to move into higher-paying analyst roles. You need the right skills, learned in the right order, and applied to practical projects.
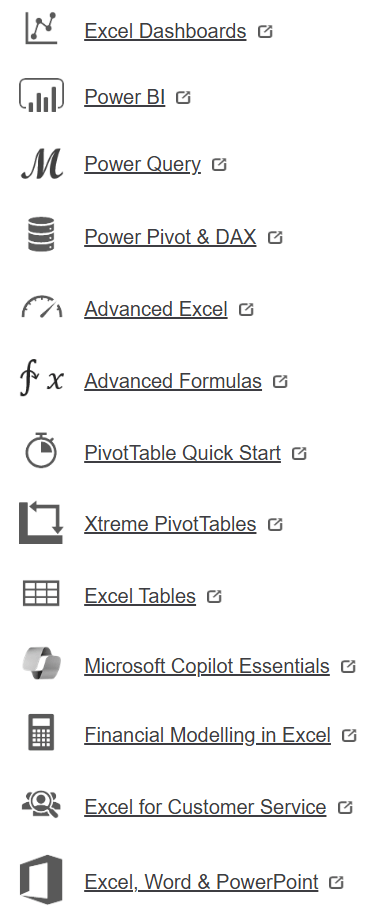
A proven progression looks like this:
- Master modern Excel foundations such as PivotTables, lookup functions, structured tables, and clean data layouts.
- Learn Power Query to automate data imports, cleaning, and transformations.
- Learn Power Pivot and DAX to build scalable data models and advanced calculations.
- Build interactive dashboards focused on clear storytelling and KPIs.
- Add Power BI to deliver enterprise-ready analytics and automated reporting.
Each step compounds the previous one and moves you closer to higher-value roles.
If you want to follow this exact roadmap without piecing it together from scattered tutorials, you can learn all of these skills step by step in my Data Analyst Fast Track program, designed to take you from Excel user to confident data analyst with real, portfolio-ready projects.
Turning Excel Skills Into Career Leverage
Knowing Excel is no longer enough. What matters is
how you use it.
When you can automate workflows, analyse large datasets, build dashboards, model financial outcomes, and deliver insights through Power BI, you stop competing for low-paying roles and start qualifying for higher-tier positions.
The key is not just learning these
skills, but communicating them clearly on your resume with measurable outcomes.
That is how Excel becomes a career accelerator rather than just a tool.
If earning more, doing more meaningful analytical work, and moving into a higher-impact role is your goal, following a structured path with my Data Analyst Fast Track program is one of the most efficient ways to get there.