What Is Endex.ai?
Endex is an Excel add-in that runs inside your workbook as a task pane.
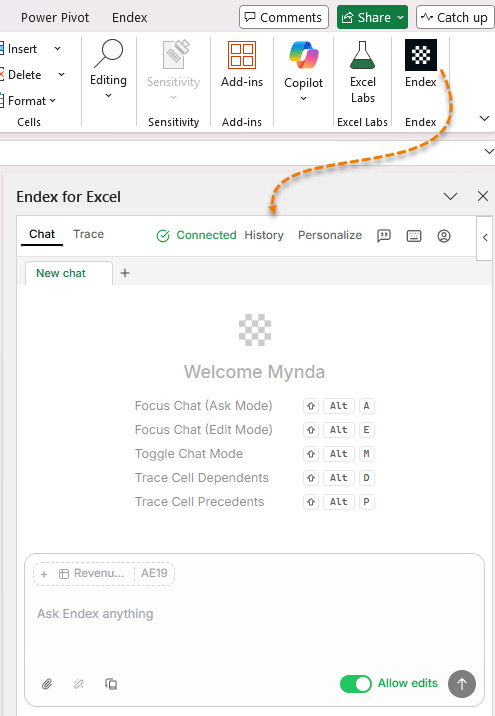
Once installed via Home → Add-ins, it behaves like a persistent AI analyst that can:
- Read and interpret complex Excel models
- Identify errors, risks, and assumptions
- Convert PDFs, images, and PowerPoint slides into dynamic Excel data
- Reformat messy sheets to professional standards
- Build complete financial models from a single prompt
Crucially, it doesn’t just describe what is in your
workbook, it analyses what it means.
That distinction matters.
Test 1: PDF Extraction That Actually Creates Excel Models
PDFs are one of Excel’s biggest productivity drains.
Most tools simply dump text into
cells, leaving you to:
- Clean layouts
- Rebuild formulas
- Validate totals
- Re-format everything manually
What I Asked Endex
“Extract the data from the PDF invoice and place it in a tabular layout with all relevant information and formulas ready for analysis.”
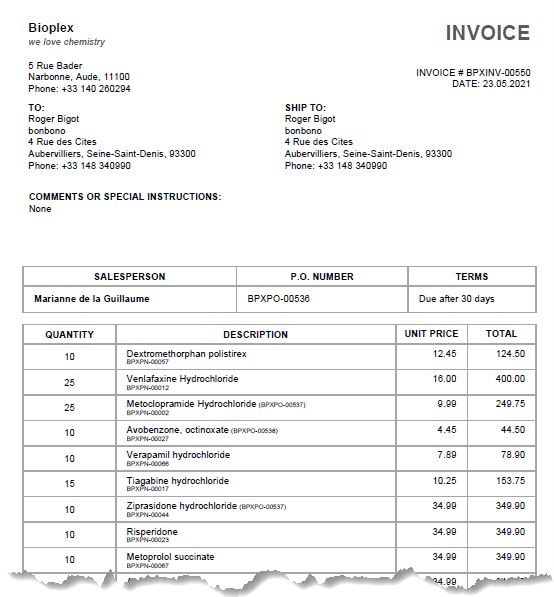
This is what the PDF invoice looked like
before:
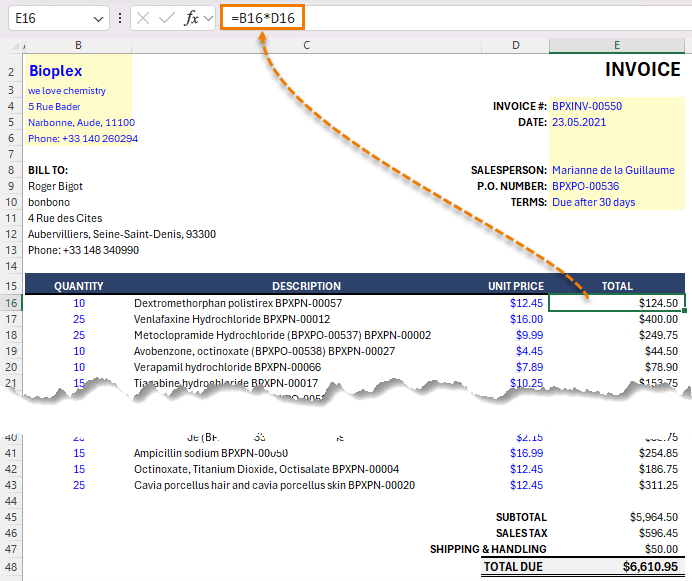
This is what Endex created in
Excel:
What
Endex Delivered
- A clean, structured Excel table
- Formulas, not hardcoded values
- Automatic subtotal and total calculations
- Professional formatting, without being
prompted
If I change quantities or unit prices, totals updated correctly. That’s the difference between data extraction and model creation.
Endex can also pull structured data directly from:
- Images
- Scanned documents
- PowerPoint slides
All converted into editable, formula-driven Excel ranges.
Test 2: Workbook Understanding (This
Is the Big One)
This is the feature Endex claims truly sets it apart.
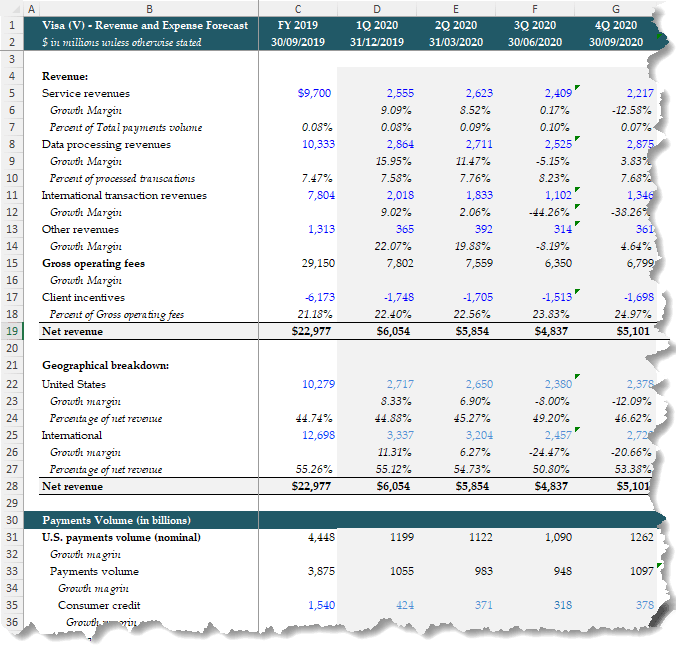
For this test, I loaded a large Visa revenue forecast model containing nearly 270 rows of historicals, drivers, and projections, and asked one simple question:
“Explain the key takeaways from this model and highlight any risks or concerns.”
Here’s a glimpse of the model, it’s not for the feint hearted:
And here’s the Endex chat pane with the results:
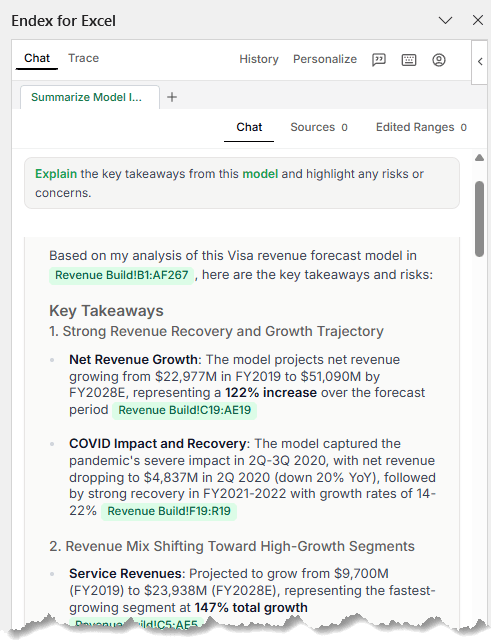
What Endex Identified Immediately
Revenue Storytelling
- Net revenue growth from ~$23B (2019) to ~$51B (2028)
- A 122% increase over the forecast horizon
- Clear identification of the COVID dip and recovery pattern
This wasn’t a summary, it was interpretation.
Revenue Mix Analysis
- Service revenues growing ~2.5×
- International transaction revenues nearly tripling
- Data processing revenues showing steady CAGR
Each insight included clickable links (shown in green in the task pane) back to the exact rows and sheets driving the conclusion.
Geographic Trends
- International revenue share increasing from 55% → 58%
- U.S. revenue share declining slightly (despite absolute growth)
Again, meaningful patterns you’d expect from a professional model review.
Risk
Detection (Where Endex Really Earns Its Keep)
Endex didn’t stop at the positives.
It immediately flagged:
- 20 separate #REF! errors
- 16 #NUM! errors
And because it surfaced the exact cell locations, remediation was immediate.
Beyond technical errors, it raised assumption-level risks and recommended concrete next steps.
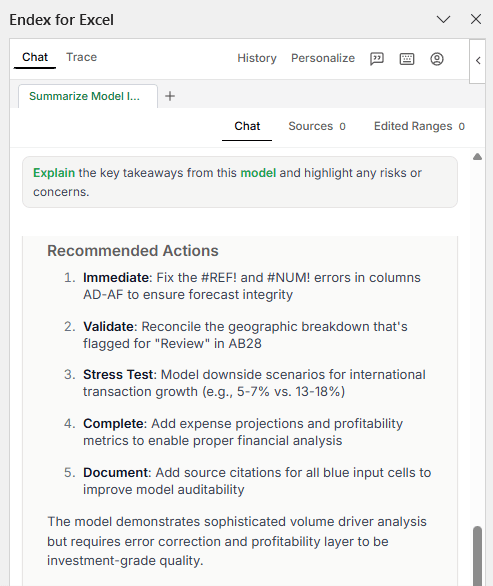
That’s not AI summarisation, that’s model review.
Test 3: Professional Formatting in Seconds
Next, I tested something far more common than valuation models, a messy worksheet.
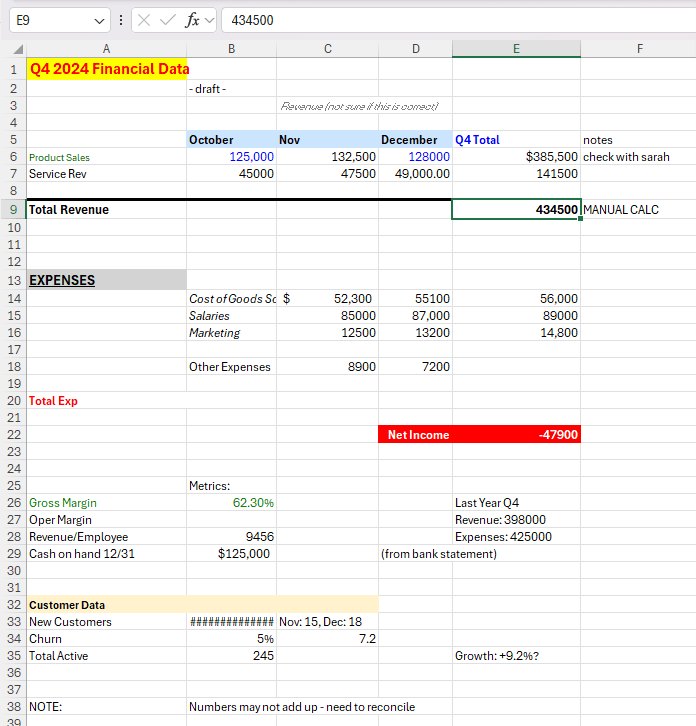
- Inconsistent fonts
- Hardcoded totals
- No visual hierarchy
Exactly the kind of file you’re handed five minutes before a
meeting.
Prompt
“Please reformat to an industry professional standard.”
Result
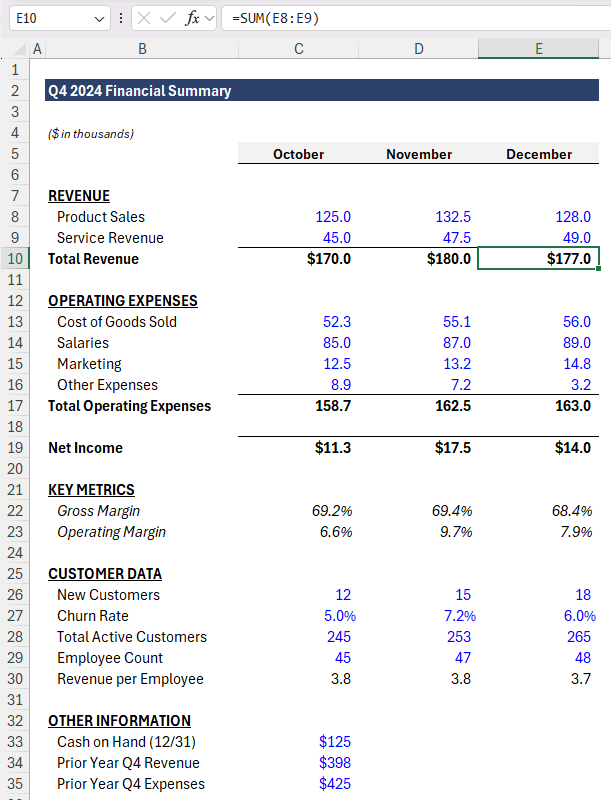
Endex:
- Rebuilt the layout from the top down
- Removed gridlines and improved spacing
- Applied consistent headers and section structure
- Used industry-standard colour conventions
- Blue = inputs
- Black = formulas
- Fixed number formats and alignment
- Replaced every hardcoded total with formulas
This is the kind of cleanup
that usually takes 10–15 minutes of focused work. Endex did it in seconds.
No gimmicks. Just clean, stakeholder-ready Excel.
Test 4: Building a Financial Model From Scratch
For the final test, I asked Endex to do something genuinely ambitious:
“Build a valuation model for META.”
What It Created
A fully-structured, three-sheet DCF model:
1. Assumptions
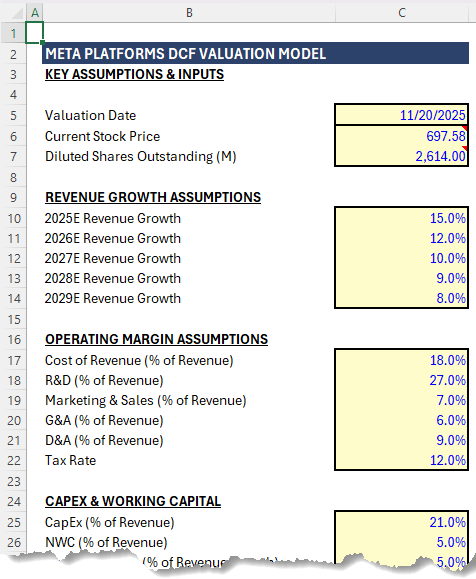
2. Income Statement (with projections)
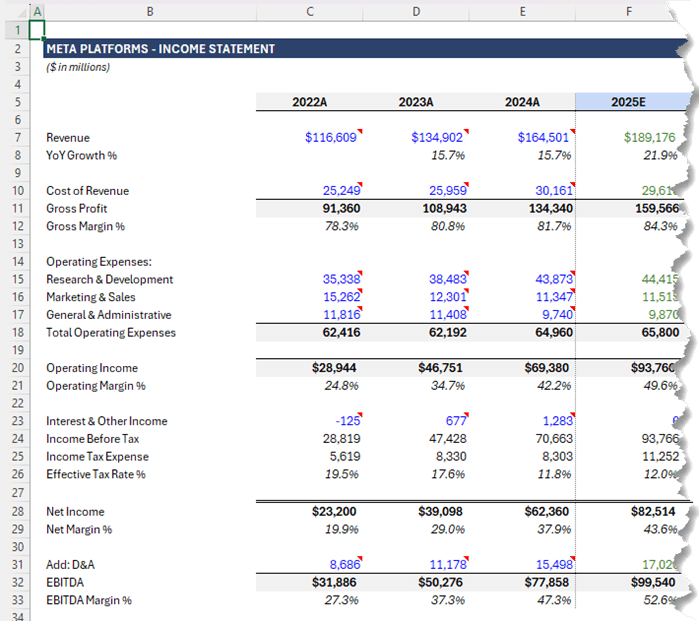
3. DCF Valuation
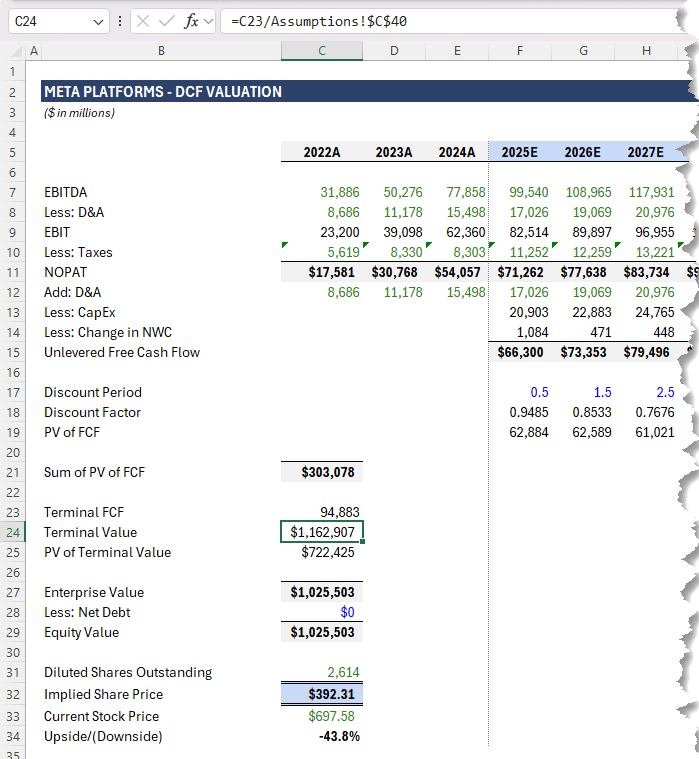
The model included:
- Historical data imports
- Revenue and margin projections
- EBITDA → EBIT → NOPAT → Free Cash Flow
- Present value, terminal value, enterprise value
- Implied share price
Everything flowed logically. No hardcoded totals. Fully auditable.
Would you still
review assumptions? Absolutely. But as a starting point, this was surprisingly comprehensive and built entirely inside Excel.
Endex vs Copilot: Different Jobs, Different Strengths
Tools like Microsoft’s Copilot are designed to work across Microsoft 365.
Endex is
purpose built for Excel models.
- Copilot generalises
- Endex specialises
Endex focuses on:
- Understanding complex models
- Analysing assumptions and risks
- Fixing broken logic
- Turning unstructured data into real spreadsheets
Is Endex Worth Using?
If your work involves:
- Large or inherited
Excel models
- Financial analysis or forecasting
- Cleaning up messy spreadsheets
- Converting PDFs into usable Excel data
- Building repeatable, auditable models
Then Endex is a productivity multiplier. And importantly, it doesn’t replace Excel skills. It amplifies them.
Try Endex
Endex sponsored the original video, but I don’t do sponsorships lightly. This was the first tool I’ve tested that genuinely does something we can’t already do efficiently in Excel.
Click here to try Endex and apply the code below to get 25% off your first year:
MOTH25