Step 1: Format Your Bank Transactions
Start with your bank transaction data: deposits from EFTPOS, Stripe, cash, or PayPal, and expenses like stall fees or insurance (entered as negative amounts).
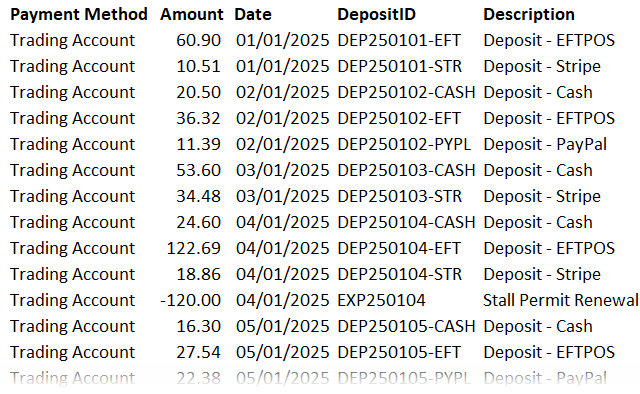
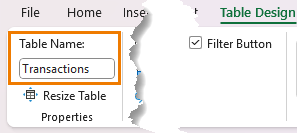
1. Format as a Table:
Select your data and press Ctrl + T. Table Design tab > rename it Transactions.
2. Add Columns for Category and Subcategory:
These will help classify each transaction automatically – see next step.
Step 2: Categorize Transactions Automatically
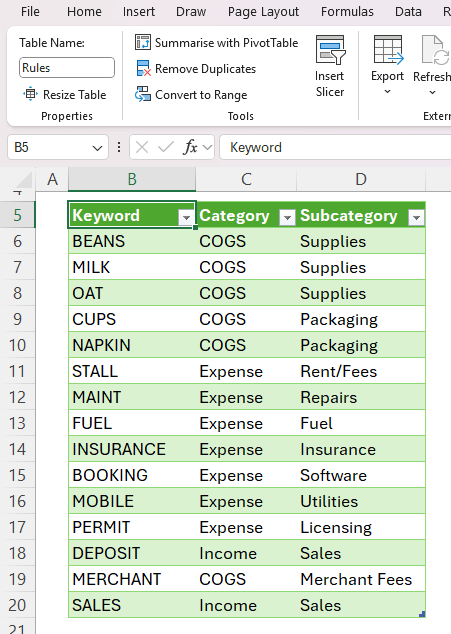
Create a lookup table named Rules that lists:
- Keywords you expect to find in transaction descriptions
- The Category (e.g., Income, COGS, Expense)
- The Subcategory (e.g., Sales, Rent, Insurance)
Back in the Transactions table, use the following formula to assign a category automatically:
=XLOOKUP(
TRUE,
ISNUMBER(SEARCH(Rules[Keyword],[@Description])),
Rules[Category],
"Uncategorised")
Then duplicate it for the Subcategory column by replacing Rules[Category] with Rules[Subcategory].
💡 The SEARCH function checks if each keyword appears
in the description.
ISNUMBER converts that result to TRUE/FALSE, and XLOOKUP returns the matching category.
Any transactions showing as “Uncategorised” just need a new keyword added to the Rules table. Excel updates everything
instantly.
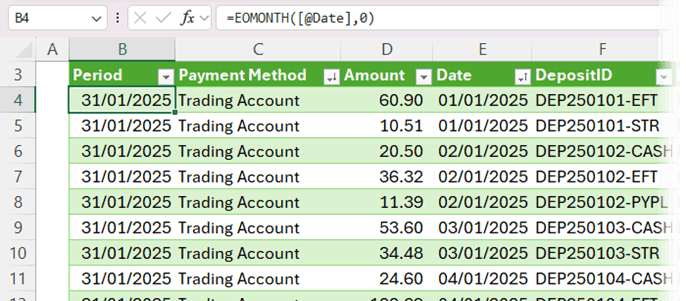
Step 3: Add a Monthly Period Column
To group transactions by month, insert a Period column with:
=EOMONTH([@Date],0)
This formula returns the last day of the month for each transaction date, making your PivotTables much easier to summarize later.
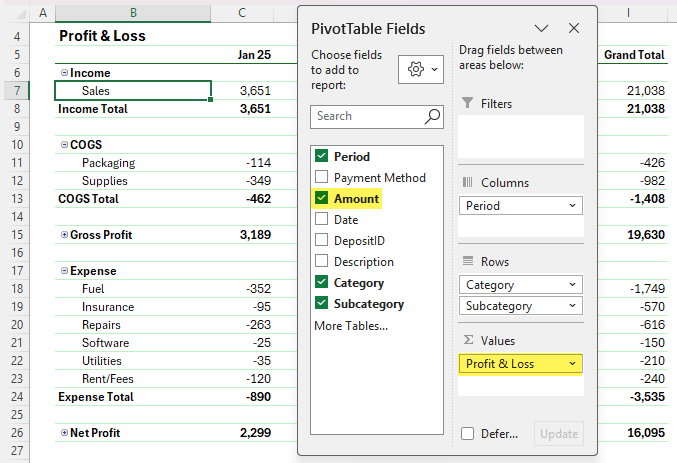
Step 4: Build the Profit & Loss Report
Insert a PivotTable from your Transactions table onto your Analysis sheet (see video for step-by-step).
- Ungroup Dates: Press Ctrl + Z if Excel groups them automatically.
- Format Dates in column labels: Right-click a date → Field Settings → Number Format → mmm-yy.
- Tidy the Layout: Remove Grand Totals, add Subtotals, and reorder so Income appears at the top.
- Add Calculated
Items:
- Gross Profit/(Loss): =Income+COGS
- Net Profit/(Loss): =Income+COGS+Expense
- Format for Clarity: Bold totals, hide +/- buttons, and apply a
clean PivotTable style.
You now have a dynamic Profit & Loss report that updates with one click.
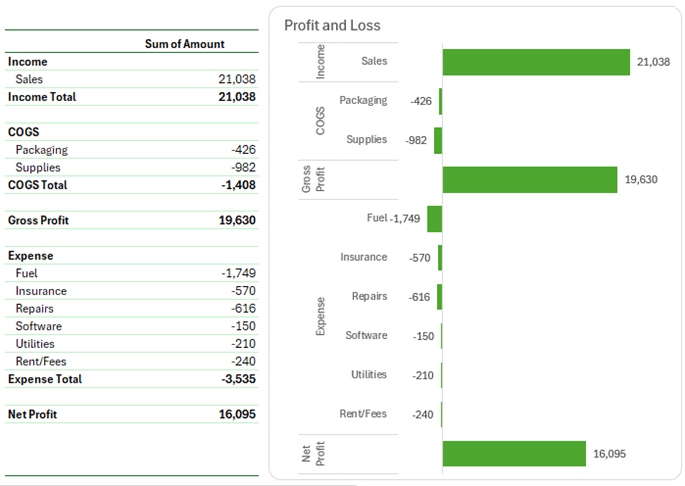
Step 5: Add a Profit & Loss Chart
To make your data easier to interpret:
- Copy your
PivotTable and remove the Period field.
- Insert a 2D Bar Chart.
- Clean it up: hide field buttons, remove gridlines and legend, reverse axis order, and adjust bar gap width to 50%.
- Change the bars to green
or whatever your theme color is, and title it Profit and Loss.
Now you’ve got a professional, easy-to-read summary of your financial performance.
Tip: hide the PivotTable under the chart for a tidy report.
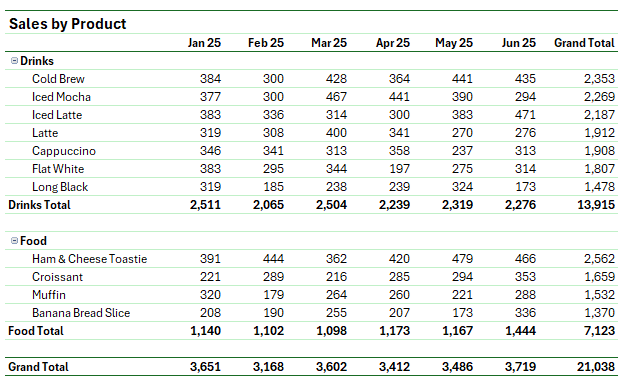
Step 6: Analyse Sales by Product
Download your sales transactions from your POS or online store.
Each record should include:
- Date
- Receipt ID
- Deposit ID
- Item, Quantity, Category
- Unit Price,
Gross Amount, Merchant Fee, and Net Amount
- Format as a Table and name it Sales_Items.
- Add a Period column using =EOMONTH([@Date],0).
- Create a PivotTable with:
- Rows:
Category and Item
- Columns: Period
- Values: Net Amount
Sort from Largest to Smallest to highlight top-selling
products. Format neatly using subtotals, compact layout, and the same style as before.
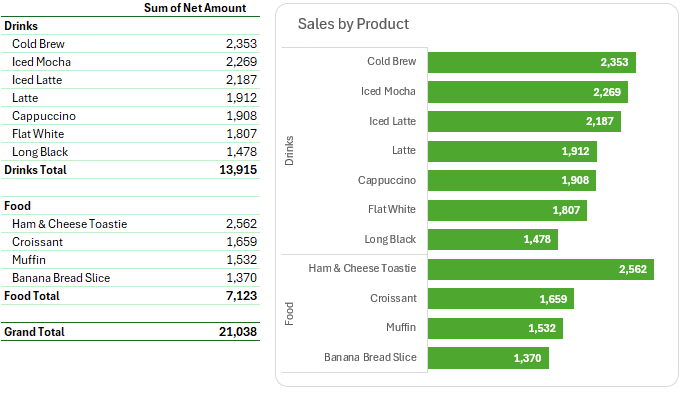
Step 7: Create a Product
Sales Chart
Copy the PivotTable, remove the Period field, and insert another 2D Bar Chart.
- Reverse the axis order
- Set Bar Gap Width to 50%
- Color bars green
- Title it Sales by Product
You can now easily compare product performance month by month.
Tip: hide the PivotTable under the chart for a tidy report.
Step 8: Update Your Reports Each Month
When new data arrives:
- Paste new bank transactions under your existing Transactions table.
- Paste new POS data below your Sales_Items table.
- Go to the Data tab → Refresh All (or use Auto-refresh if your Excel version supports it).
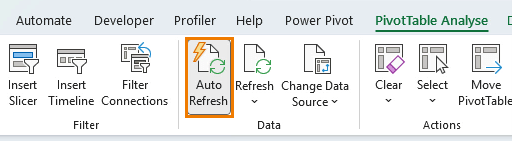
That’s it, your entire dashboard updates instantly.
Bonus: Automate
It with Power Query
If you want to skip the copy-paste step, you can automate data import directly from your bank or POS system using Power Query. This is exactly what I teach in my
This is exactly what I teach in my Power Query course, and for a limited time, all courses are 20% off during the Black Friday Sale at myonlinetraininghub.com/courses