Step 1: Defining Categories
Your financial tracker begins with a clear structure of income and expense categories.
1. Create a Categories Sheet
- Start by
listing your income and expense subcategories (e.g., "Groceries," "Salary").
- Organize them into larger groups (e.g., "Living Expenses," "Income Sources").
- Add a column to indicate whether each category is an income or an expense.
2. Format as a Table
- Use the shortcut CTRL+T to convert this list into an Excel table. This allows Excel to dynamically include new items when added.
3. Name and Style Your Table
- Rename the table to "Categories" for easy reference.
- Apply a light grey table style for clarity.
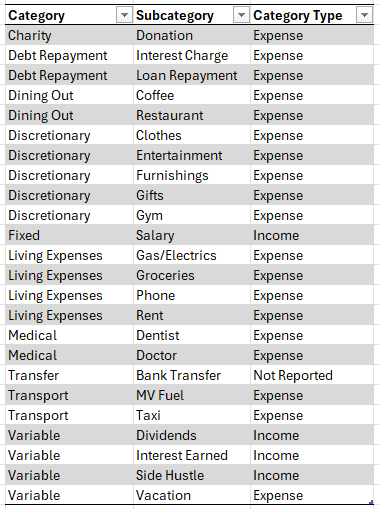
Your table should look like this, customised for your own categories and subcategories:
4. Set Up Subcategory for use in Data Validation
- Define a name for the subcategory column. Select the subcategories, then go to the Formulas tab > Define Name. This ensures dropdowns across the workbook (which we'll set up in a later step) update automatically with any changes.
(Note: Google
Sheets users don't need to define a name.)
Step 2: Bank Transactions Table
Now, let's classify your bank transactions using your new categories.
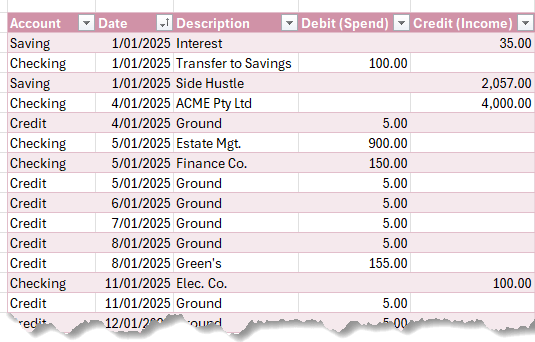
1. Import Transaction Data
- Copy and paste data from your bank statements into a table. Include columns for date, description, debit, and credit.
- Add an "Account" column to track transactions from multiple accounts.
2. Categorize Transactions
- Insert a
formula to calculate net values (Income - Expenses) for ease of reporting.
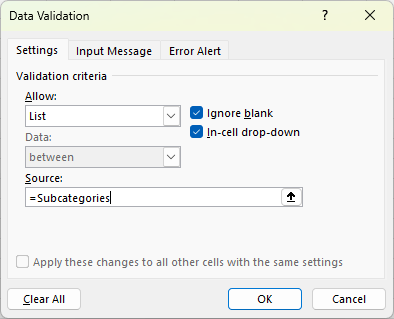
- Set up data validation to enable a dropdown list for selecting subcategories: Select subcategory column cells > Data tab > Data Validation > List. The Source is the defined name you created in the previous step for the subcategories column of the categories table:
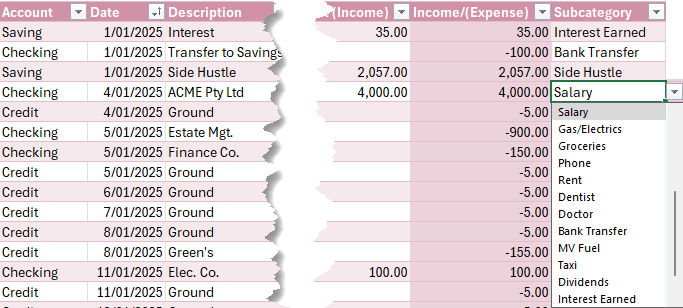
- Select the subcategory for each transaction from the dropdown
list:
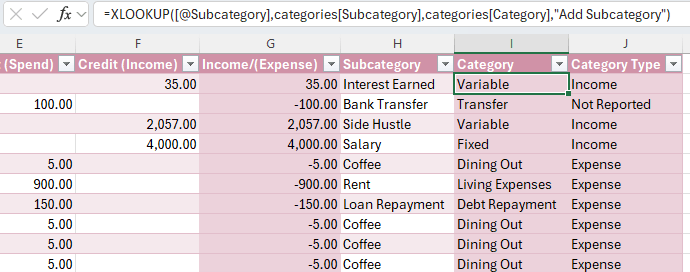
3. Lookup Categories and Types
- Use XLOOKUP (or VLOOKUP) formulas to fetch the category and type based on the chosen subcategory.
4. Adding New Data
- Simply paste new transactions onto the next available row below the table. Excel's dynamic table feature will automatically include them,
ensuring all linked formulas and references stay intact.
- Then select the subcategory for each transaction. More on updating the report later.
Step 3: Build Interactive Reports with PivotTables
With your data ready, it's time to create actionable insights - see video for step by step instructions for
building the PivotTables.
1. Income and Expense Reports
2. Analyze Trends
- Group dates by year and month to display income or expenses over time.
- Copy PivotTables and adjust filters to show metrics like "Net Savings" or detailed
breakdowns by subcategory.
3. Dynamic Filtering with Slicers
- Add slicers for year and month to make filtering reports intuitive.
- Link slicers to specific PivotTables to streamline navigation.
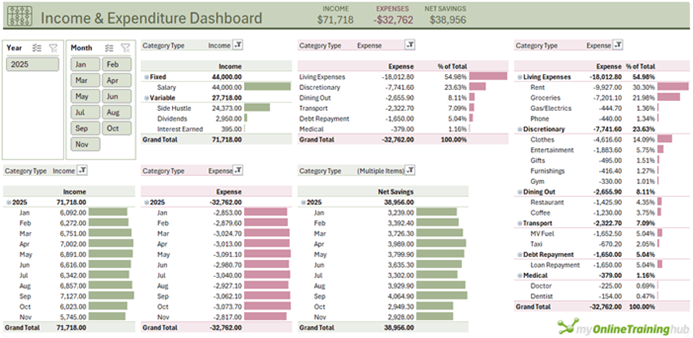
Step 4: Create a Dashboard (optional)
For quick insights, design a professional dashboard:
- Add a header, such as "Income & Expenditure Dashboard."
- Display key metrics:
total income, expenses, and net savings (PTD - Period to Date).
- Use Excel's GETPIVOTDATA function to reference PivotTable Income & Expense totals dynamically.
- Format as currency and add visual elements like icons for a polished look.
Your Income & Expense Tracker should look similar to this:
Step 5:
Automating Updates
Updating your finance tracker is as simple as refreshing the data:
- Copy new transactions into the transactions table.
- Add the subcategories for each transaction.
- Go to the Data tab > Refresh All to update PivotTables and slicers automatically.
Smarter Decisions, Better Finances
This simple tracker is more than just a tool — it's a gateway to smarter financial decisions. By analyzing where your money goes each month, you can identify trends, cut unnecessary spending, and work toward your financial goals.
Next
Steps: Controlling Your Budget
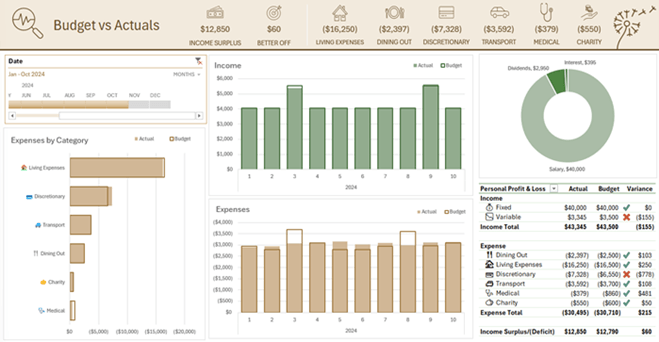
Ready to take control of your budget? Check out our Personal Budget in Excel guide to learn how to compare actual spending to budgeted goals for even greater control over your finances.
This Excel-based finance tracker is powerful, easy to maintain, and
adaptable to your needs. Happy tracking!


