Understanding the Raw Data
Before we begin, let’s look at the challenges in the dataset:
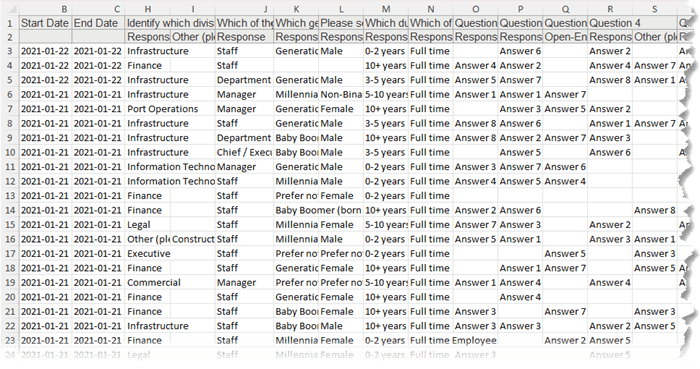
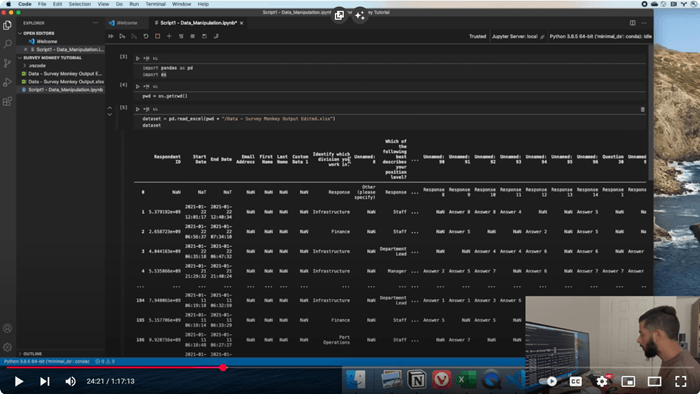
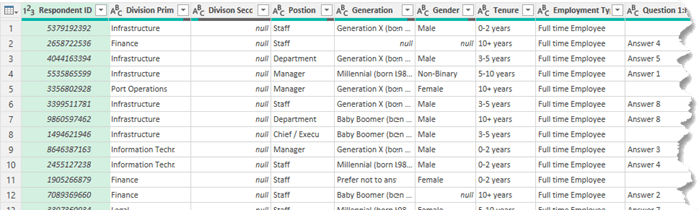
- Headers spread over two rows: The column headers are split over rows 1 and 2 and need to be combined.
- Multiple columns for each question: Each survey question is in a separate column (columns O:CV).
- Missing question numbers: Only the first response for each question contains a number (visible in column S in the image above).
- Empty columns: Some columns contain no useful data and need to be removed (not shown in screenshot).
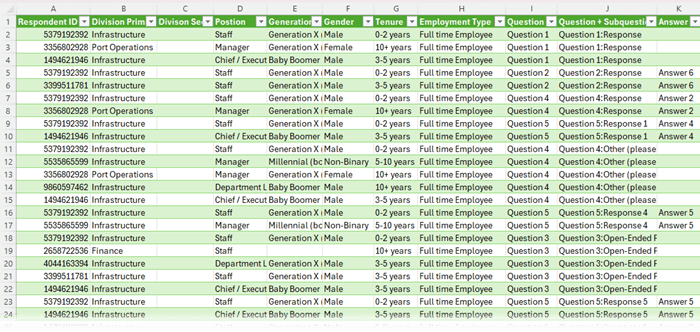
- Final desired layout (shown below): We need a tabular format, where each question and sub-question is a row, with additional columns for response counts
(the last two columns are not visible in the screenshot below).
Step 1: Cleaning Headers with
Power Query
Instead of using copy-paste and formulas like in Shashank’s method, Power Query makes this process much faster.
1. Load Data into Power Query
- Select cell A1 and press CTRL + A to select all data.
- Go to the Data tab and choose From Table/Range.

- At the Insert Table dialog box, uncheck “My table has headers” since headers span two rows.
2. Transpose and Fix
Headers
- In the Power Query window, go to Transform > Transpose.
- Select Column1 and go to Transform tab > Fill Down to populate missing question
numbers.
- Hold SHIFT and select Column1 & Column2 with a colon separator using Add Column > Merge Columns.
- Right-click the new column > Move to the beginning
- Delete Column 1 & Column 2 as these old heading columns are no longer required
- Transpose the data back
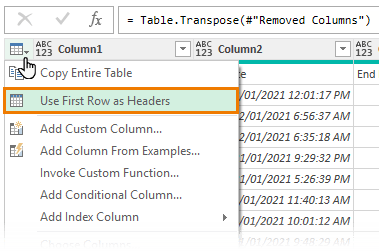
- Promote the first row to headers:
Step 2: Removing Unnecessary Columns
- Select unwanted columns (e.g., Start Date through to Custom Data
1).
- Press DELETE to remove them.
- Rename demographic columns for clarity (e.g., Division Primary, Division Secondary, Generation, Tenure & Employment Type).
Your query should now look
like this:
Step 3: Unpivoting the Data
The raw survey data is in a wide format. To analyse it effectively, we need to convert it to a long or tabular format.
1. Replace Nulls with Blanks
- Select question columns.
- Use Transform > Replace Values to replace null with an empty string.
If we don’t take this step, any rows with null values will be removed in the next step.
2. Unpivot Questions
- Select the demographic columns (Hold SHIFT and left click Respondent ID to Employment Type).
- Right-click and choose Unpivot Other
Columns.
- Add Column for the Question. Select Attribute column > Add Column > Extract > Text Before Delimiter. The delimiter is the colon.
- Rename Columns: Attribute = Question + Response, Value = Answer and Text Before Delimiter = Question.
- [Optional] Rename query: Unpivoted Data
Now, each question and sub-question is in a single column, making analysis much easier. We could stop there and skip
to step 6 and analyse the data using PivotTables and formulas, but Shashank’s client wanted two calculated columns added.
Step 4: [optional] Calculating Respondent Counts
Count Number of Respondents per Question
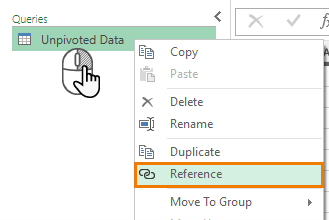
1. Reference the Unpivoted Data query.
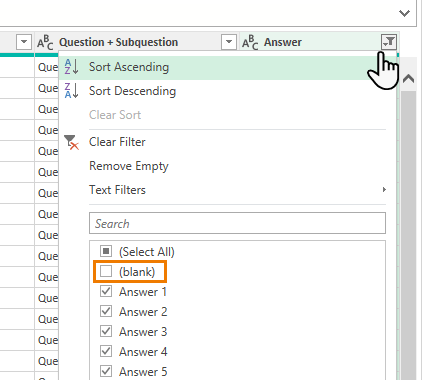
2. Filter out blank responses from the Answer column:
3. Select Respondent ID & Question (hold CTRL to select non-contiguous columns), then right-click > Remove Other Columns.
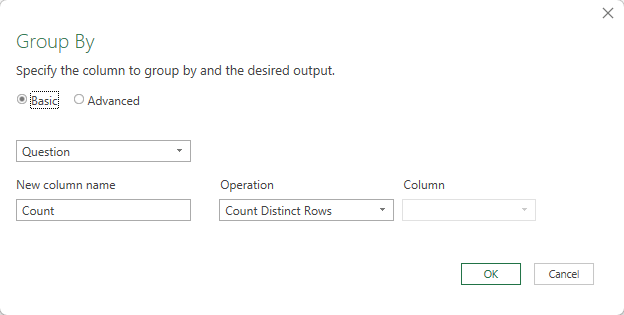
4. Select Question column, then Home tab > Group By > Count Distinct
Rows.
5. Rename query: Number of
Respondents.
Count Number of Respondents per Answer
1. Reference the original query again.
2. Filter out blank responses from the Answer column.
3. Select Respondent ID, Question + Sub-question, and Answer (hold CTRL to select non-contiguous columns), then right-click > Remove Other Columns.
4. Select
Question + Sub-question, and Answer.
5. Home tab > Group By (advanced) > Count Distinct Rows:
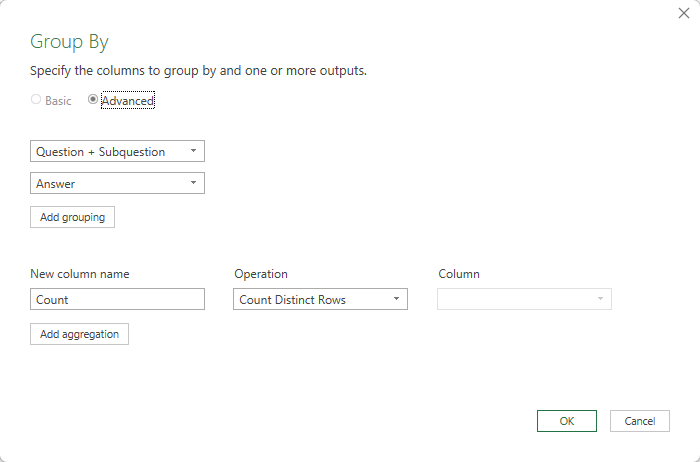
6. Rename query: Same Answer Count.
Step 5: [optional] Merging Queries
1. Merge the Unpivoted Data query with ‘Same Answer Count’.
- Select the Unpivoted Data query > Home tab > Merge Queries > As New
- Match Question + Sub-question and Answer.
- Use a Left Outer Join.
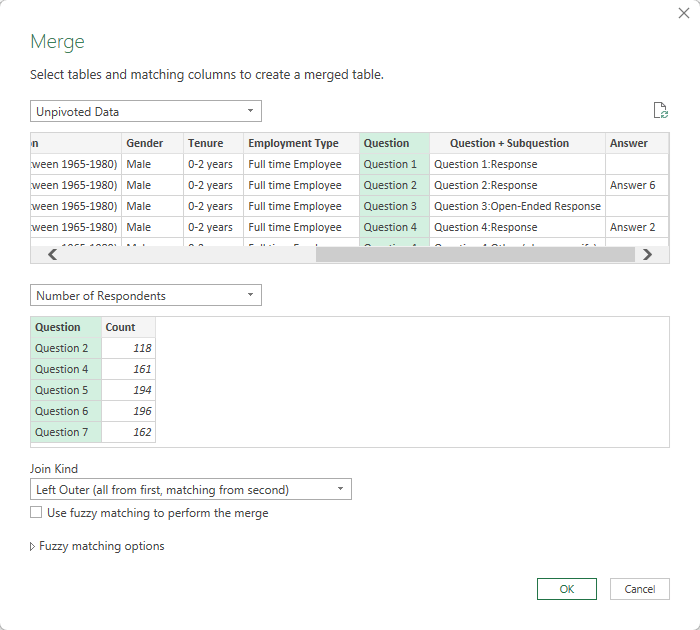
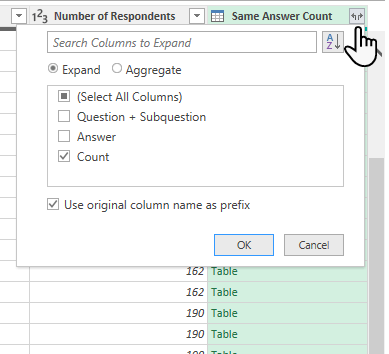
- Expand the merged column to bring in counts:
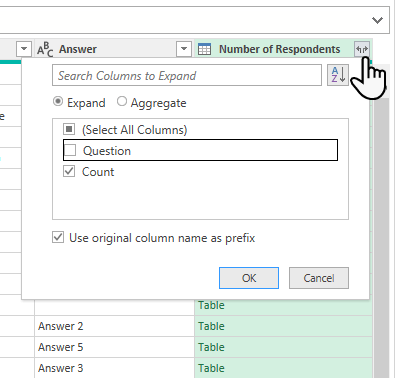
- Rename the column ‘Number of Respondents’.
- Rename the query ‘Final’.
2. Merge this query with ‘Number of Respondents’.
- Home tab > Merge Queries
- Match Question and Answer columns (hold CTRL to select multiple columns to
match).
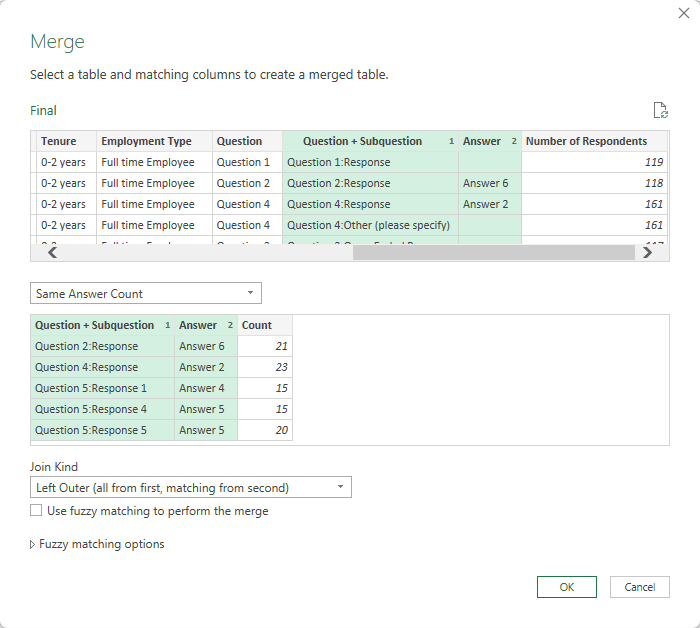
- Use a Left Outer
Join.
- Expand the column to bring in respondent counts:
- Rename the merged column ‘Same Answer Count’.
Step 6: Loading the Clean Data
1. Close & Load To > Connection Only (for intermediate queries).
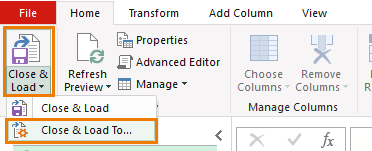
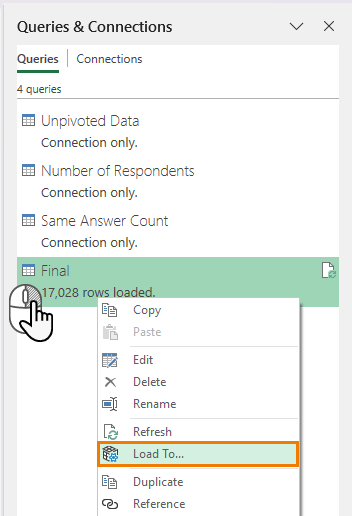
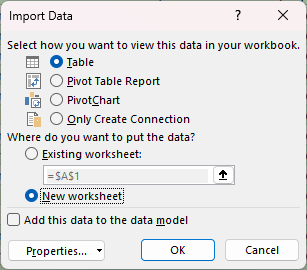
2. Edit Final Query > Load To >
3. Table in New Worksheet:
4. Verify the row
count matches expectations.
Step 7: Automate with One Click
Power Query records every transformation step. If you receive new SurveyMonkey data, just make a copy of the file and paste in the new data over the top of the original data. Go to the Data tab > Refresh All, and Excel will
apply the same cleaning process instantly—no coding required!
Why Choose Power Query Over Python?
- Faster: Reduce an hour of work to just 5 minutes.
- No Debugging: Avoid scripting errors and syntax issues.
- 100% Repeatable: Apply the same steps to new data with a single click.
Ready to master Power Query? Check out my comprehensive
course here and automate your data workflows today!