Click here to read this email in your browser:
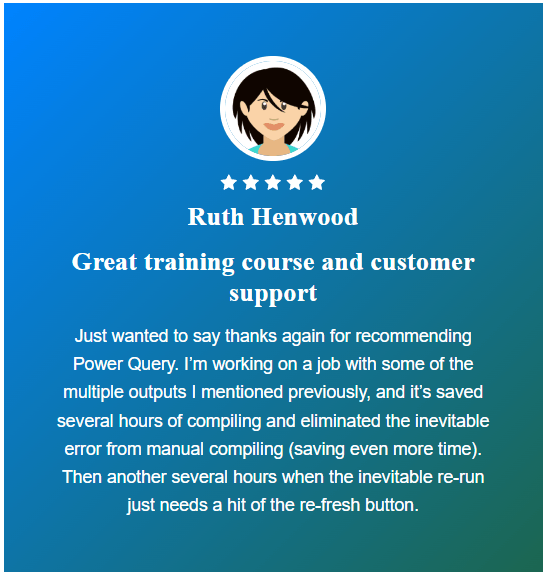
{{ message.archive_url }} Hi , Start 2025 with confidence! This is your year to master Excel and Power BI—the tools that set you apart in the workplace. Right now all our courses, renewals and upgrades are 20% off. Our customers' experiences speak for themselves: 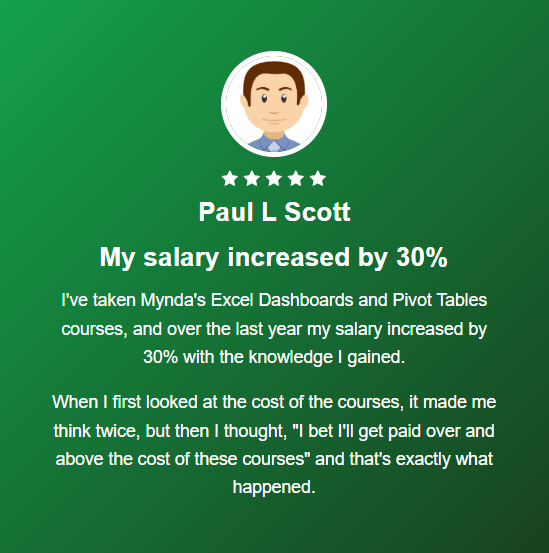
Imagine confidently building dashboards, automating workflows, and analyzing data like a pro. Our practical,
easy-to-follow lessons give you the skills to transform your work—and get rewarded for it. Whether you’re an Excel newbie or want to dive into advanced tools like Power Query, Power Pivot, and Power BI, we’ve got a course for every skill level. Our Courses are Different🔥 Learn Faster, Without the Fluff: Our courses focus on real-world skills that save you time and effort. No unnecessary waffle and filler lessons just for the sake of a long course.
🤝 Support & Guidance, When You Need It: Get
access to our mentoring and support to ensure every lesson is worth the investment.
Don’t Miss Out: Save 20% on all courses and take the next step in your career. Your Next Career Level Starts Here: Whether it’s a promotion, recognition, or confidence in your skills, we’re here to make it happen. Let’s achieve your goals together—starting today! Mynda
Microsoft Excel MVP 
| | Dashboards provide insight, analysis and alerts by displaying key trends, comparisons and data in interactive reports. The reader can filter data and change views to find answers to their questions and
problems. Read More
| 
| | Microsoft’s latest business intelligence (BI) & data visualization tool enables you to quickly develop stunning
interactive dashboards. Embed Excel charts, tables, Pivot Tables and dashboards in your Power BI dashboards, then securely share your dashboards to any device. Read
More
| 
| | Get quickly up to speed with Excel's functions. This course covers the fundamentals for each function, and less obvious uses for them. It's these more advanced techniques that will really set you apart from the crowd. Read More
| 
| | Make huge efficiency gains by using dynamic named ranges to automatically update formulas, Pivot Tables and charts. Automate formatting like banded rows or columns; sorting and filtering; and totals and statistics.
Everything you need to work with Tables in less than 1 hour. Read More
| 
| | This short course will quickly have you building
your own Pivot Tables with confidence. Start with the ideal data layout for creating Pivot Tables. Then move on to formatting, aggregation, pivot charts, filters, slicers and much more. Read More
| 
| | Get data from almost any source (a database, the web, Excel, Sharepoint, Salesforce, OData etc), then clean, transform, merge and append data to your query. Load the data into Excel or Power Pivot for analysis, report preparation or export. Read More
| 
| | Import millions of rows of data, create relationships between different data sources, and build interactive reports. Quickly transform huge volumes of data into meaningful information to get the answers you
need. Read More
| 
| | Designed to take you from zero to hero so you can confidently list 'Advanced Excel Skills' on your resume/CV. Starting with the essentials, then
covering must-know skills like best workbook design, advanced formulas, pivot tables, conditional formatting, macros and much more. Read More
| 
| | Learn the
core concepts of the three primary financial statements : Income Statement, Balance Sheet and Cash Flow Statement. By understanding core concepts you can avoid common mistakes when working with these three statements. This course breaks down the modelling process into small segments that are easily digestible. Read More
| 
| | Ideal for those involved in managing the daily operations of a business. Covering tasks such as calculating breakeven, optimizing shipping, allocating funds to maximize NPV/profit, or managing staff scheduling. Includes an introduction to Excel Solver and how to create Gantt
Charts. Read More
| 
| | Learning to use Pivot Tables will allow you to quickly summarise and analyse large amounts of data -
with just a few clicks of your mouse. Quickly transform data into meaningful information, and create reports that are easy to update and change. Read
More
| 
| | Choose just one of these, or choose any combination of the three. Learn the core software tools any professional needs in a modern office environment. Read More
| 
| | Use Excel's existing tools to make business decisions under uncertainty by performing Monte Carlo simulations, using Decision Trees and Forecasting with the Data Analysis Toolpak. Ideal for executives,
analysts and all levels of business school students. Read More
| 
| | Designed for professionals working in
customer service or call center environments. Efficiently and accurately collect and analyze data. Create forecasts and generate clear, meaningful charts and reports. Boost your skills in handling customer service and call center information. Read More
| 
| | Leverage Excel tools for financial analysis including Time value of Money functions, What-If analysis, Goal Seek, Amortization, Depreciation, and Solver Ideal for accountants, executives, analysts and all levels of business school students. Read More
| 
| | Statistics for the non-statistician. Quickly and efficiently calculate and report the statistics of data and make decisions based on statistical output. Use the Excel Analysis Toolpak to generate descriptive
statistics, histograms, correlations, regression, rank & percentile, random numbers, and sampling. Read More |
|
|
|