Column Charts: The Go-To for Category Comparisons
Column charts are your go-to option when you need to compare categories side by side. They help you easily spot size differences between data points, but it's important to avoid common mistakes:
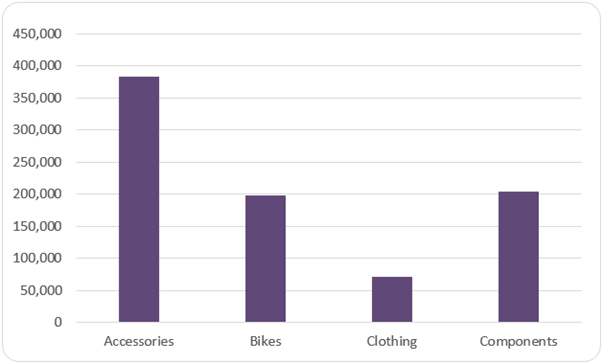
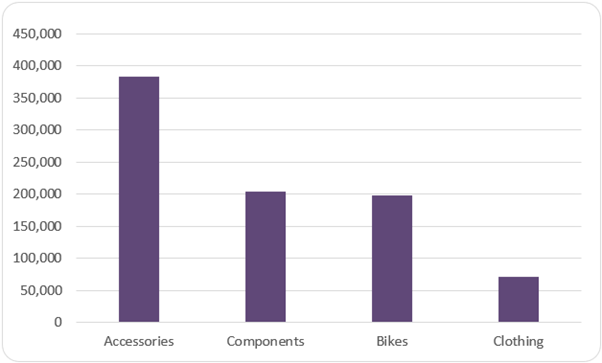
Tip 1 - Sort by Values, Not Labels: People often sort the data alphabetically by category names, but sorting by values instead helps focus
attention on the most important data and speeds up interpretation.
Tip 2 - Start the Vertical Axis at Zero: One of the biggest mistakes is starting the vertical axis above zero, which exaggerates differences between columns. For example, a vendor may seem two-thirds larger than another:
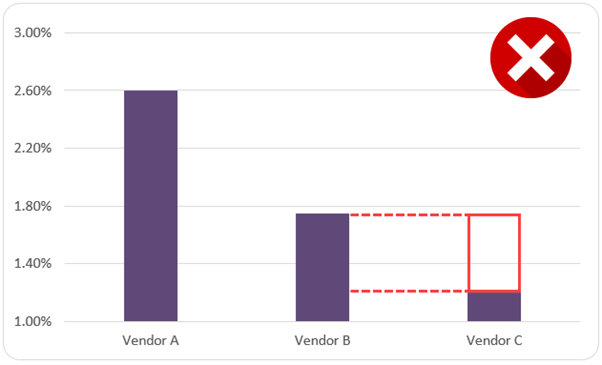
When it's only one-third larger:
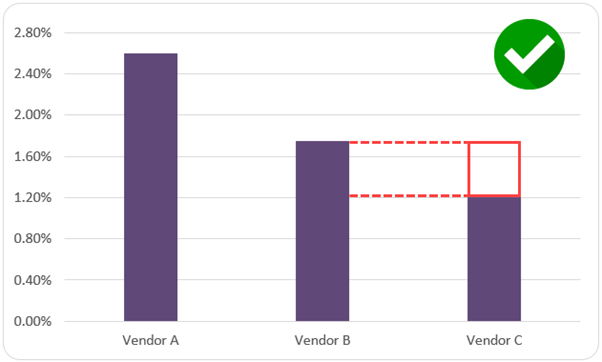
Always start your vertical axis at zero to avoid misleading visualizations.
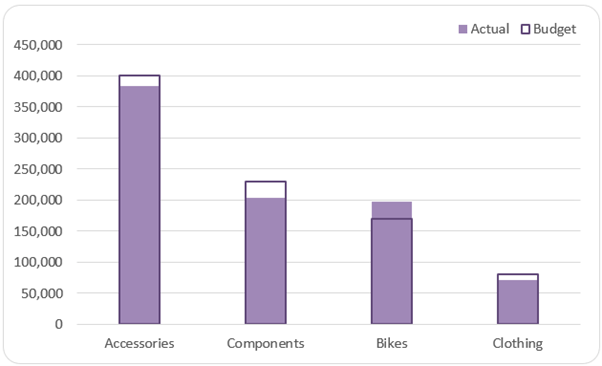
Tip 3 - Compare Against Targets: If you're measuring actual vs. target values, align columns with one filled and the other outlined to create a thermometer-like effect.
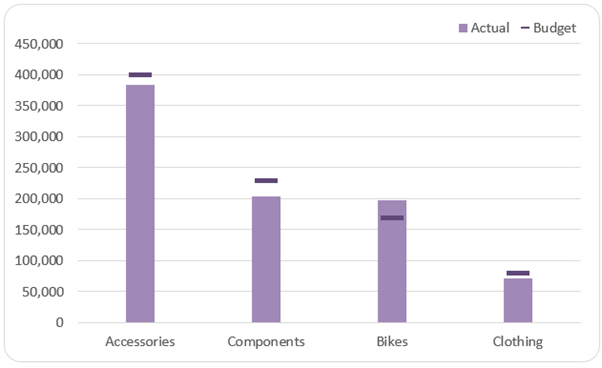
Alternatively, use markers to represent target values.
Tip 4 - Switch to Bar Charts for Long Labels: If you have many categories or lengthy
labels, switch to a horizontal bar chart.
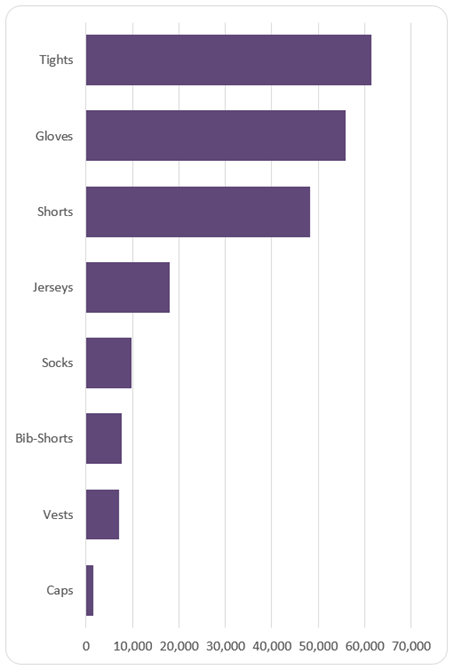
Keep in mind that it's essentially a column chart turned on
its side, so the axis should still start at zero.
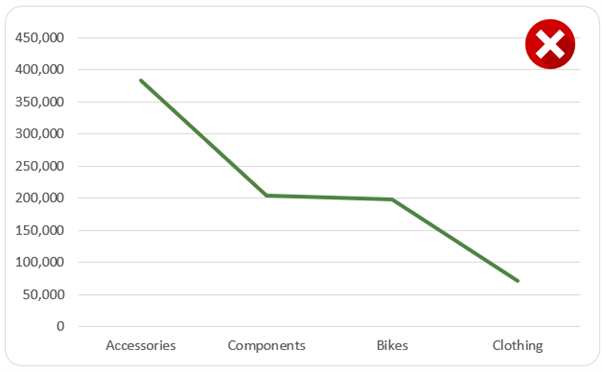
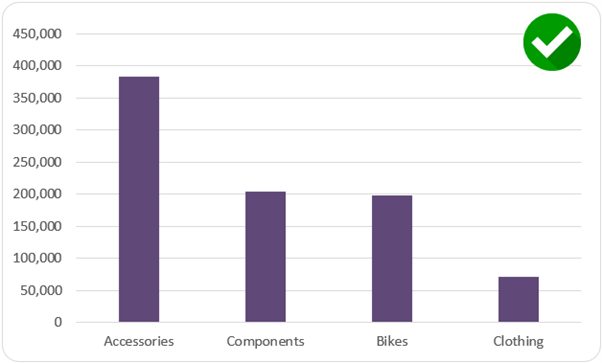
Tip 5 - Avoid Pie Charts for This Data: Don't use pie charts to compare categories, as they aren't suited for this type of analysis.

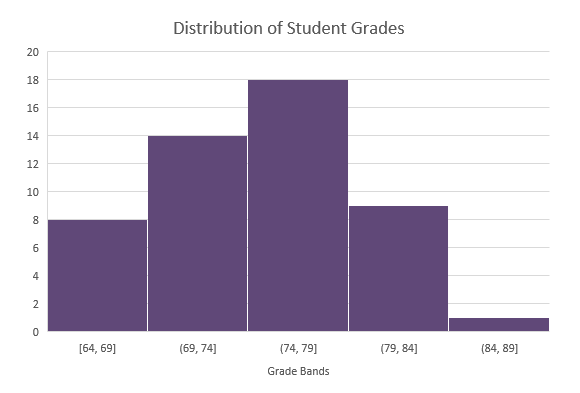
Tip 6 - Histograms - Understanding Distribution: Histograms are a form of column chart that groups data into bins of equal size, making it easy to understand the distribution of your data.
For example, a histogram showing student grades can display how frequently different grade ranges occur.
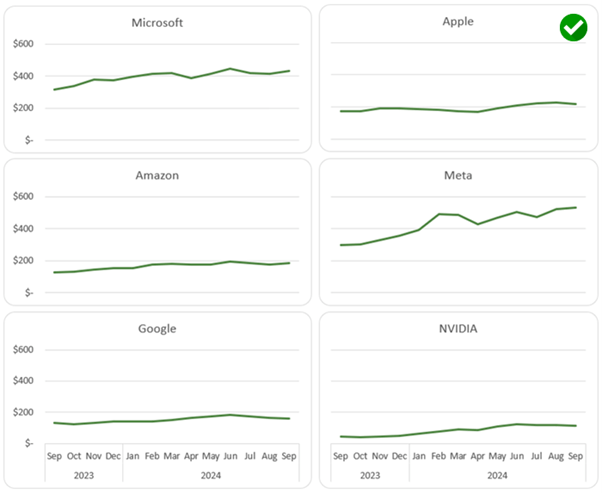
Line Charts: Ideal for Trends Over Time
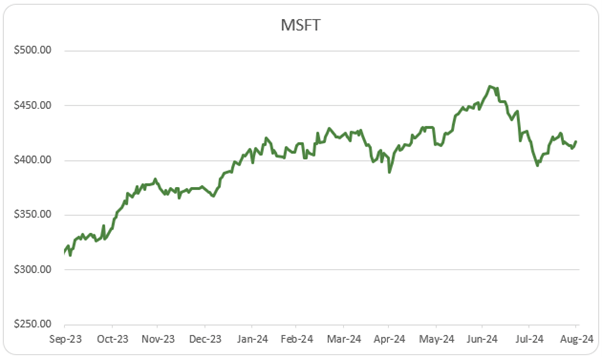
Line charts excel at showing data trends over time. They're perfect for visualizing stock prices, sales figures, or any other data where time is a key variable.
Unlike column charts, it's okay to start the axis above zero in a
line chart because viewers rely on the position of the line rather than the height of a bar.
Tip 1 - Keep It Simple: Don't overcrowd the chart with too many lines. Stick to 2-3 series for easy comparison.
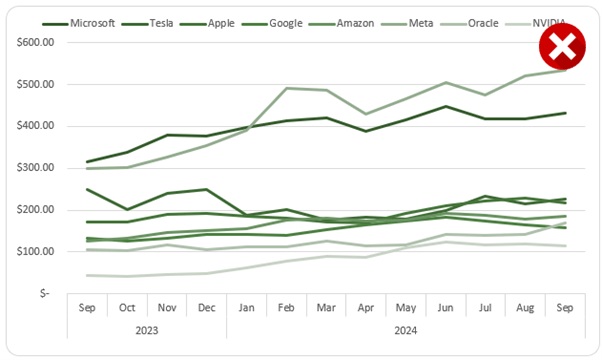
If you need more, consider breaking them into separate charts. If comparing multiple line charts, ensure the vertical axis scale is the same across all charts. This makes the comparison fair and avoids confusion.
Tip 2 - Categorical Data Isn't for Line Charts: Avoid using line charts to compare unrelated categories. Line charts work best with continuous data, like time, not categorical data like sales regions.
Pie Charts: Displaying Parts to a Whole
Pie charts are among the most misused charts. While they do a good job showing parts of a
whole, they should be used sparingly and under specific conditions:
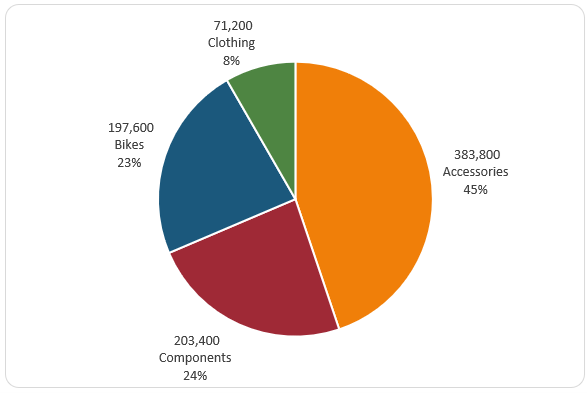
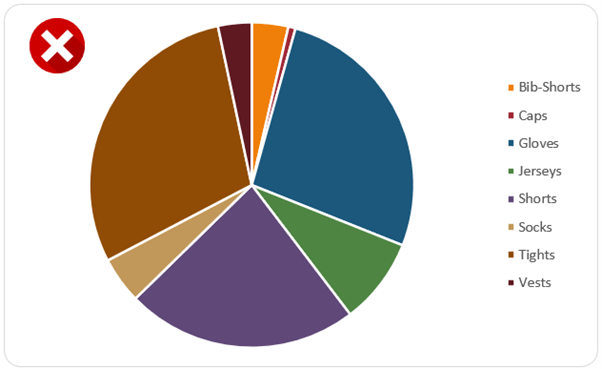
Tip 1- Limit Segments: Stick to five or fewer segments for readability. Anything more than that makes it hard to interpret.
Tip 2 - Sort from Largest to Smallest: Always arrange the segments starting at 12 o'clock, moving clockwise from the largest to the smallest segment.
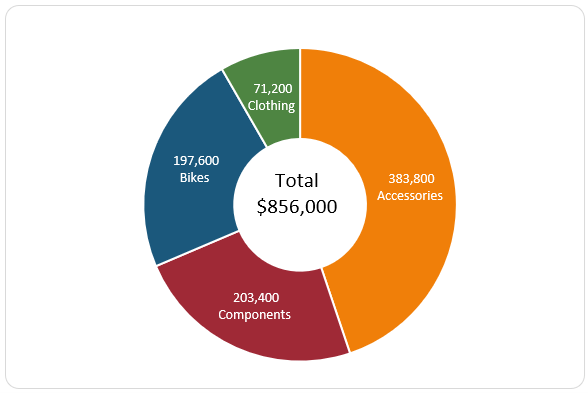
Tip 3 - Consider Doughnut Charts: For a modern look, or if you want to display a total in the
center, consider using a doughnut chart instead of a pie chart.
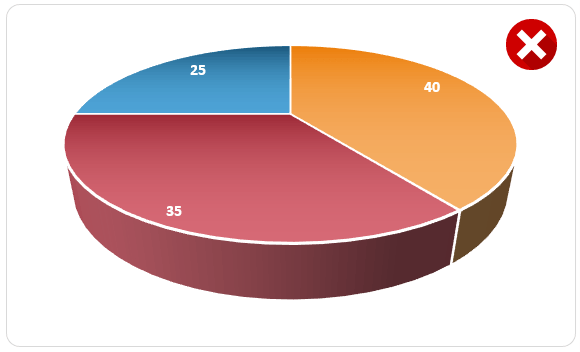
Tip 4 - Avoid 3D Pie Charts: Although 3D charts may look visually appealing, they distort data, making it harder to interpret the actual proportions.
Tip 5 - Don't Use Pie Charts for Similar-Sized Data: If your data has segments that are similar in size, a pie chart won't show differences. Instead, use a bar or column chart for better clarity.
Scatter Plots: Showing Relationships Between Variables
Scatter plots are ideal for showing relationships between two variables. They are particularly useful
when exploring how one factor affects another, such as how marketing spend influences sales growth.
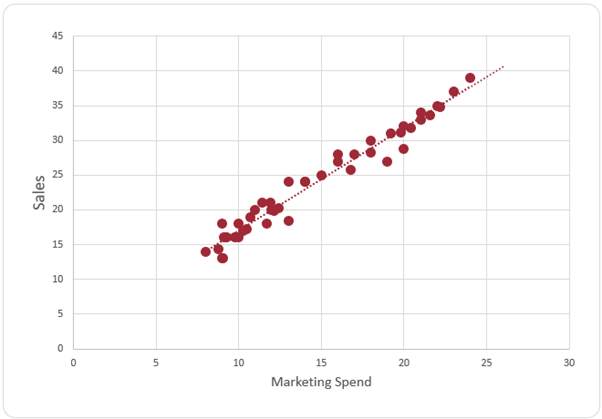
Tip 1 - Spot Outliers and Clusters: Scatter plots make it easy to identify outliers and clusters in your data.

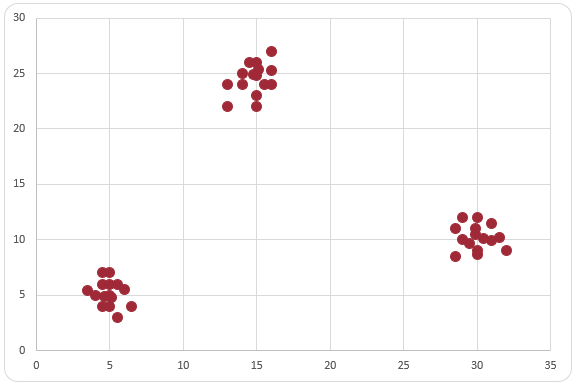
However, too many data points can create clutter, so be mindful of that.
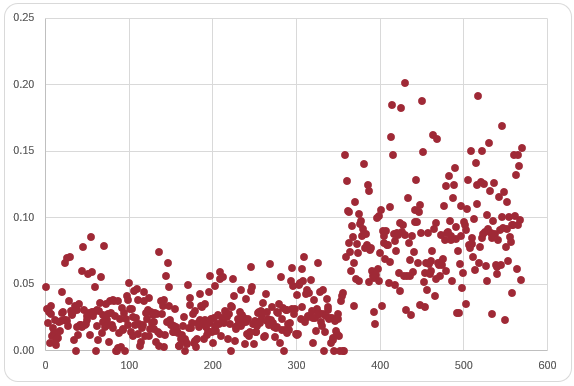
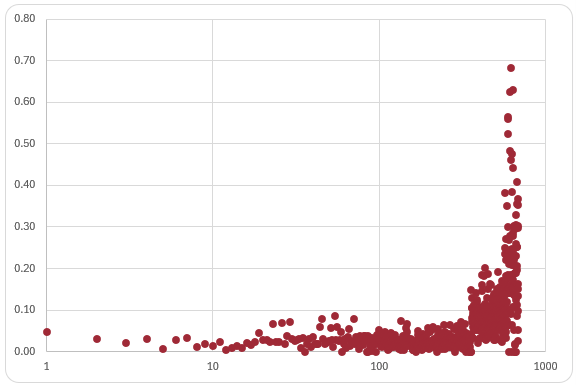
Tip 2 - Use Logarithmic Scales: When data points are tightly clustered or span a wide
range, a logarithmic scale can help reveal patterns that would otherwise be hard to see.
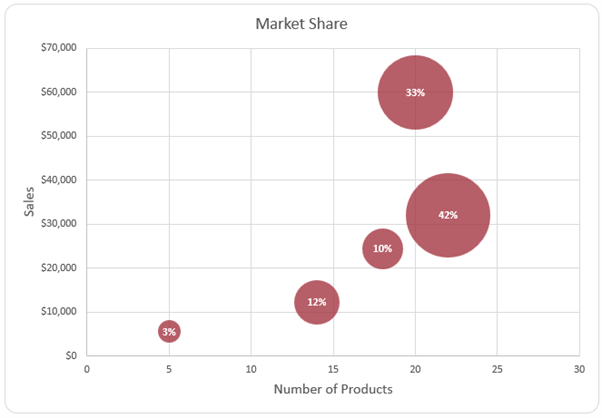
Tip 3 - Bubble Charts for Extra Dimension: If you want to add a third variable, use a bubble chart. The position of the bubbles shows the relationship between two variables, while the bubble size represents a third variable, such as percentage of market share.
Next Steps
Selecting the right chart is key to making your data understandable and impactful. By following these best practices, with just four different chart types you can create visuals that communicate your insights clearly and avoid common
pitfalls.
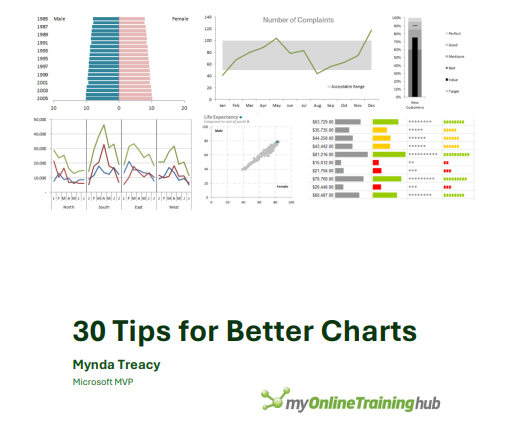
Want to take your Excel reports to the next level? My Excel Dashboard Course will teach you how to create dynamic, professional dashboards that update with a single click! You'll learn to
transform raw data into polished visuals, with hands-on support and example files to guide you. Check out the course here and start building powerful dashboards like the one below today!