Hi Imagine transforming tedious data wrangling into your favorite challenge at work.
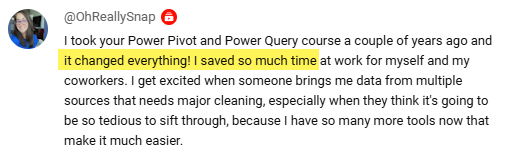
That’s what one of
our learners achieved after taking our Power Pivot and Power Query courses:
These tools don’t just save you time—they empower you to tackle challenges head-on and turn them into career-defining opportunities. Finish 2024 strong and start 2025 even stronger. Note: The 20% discount has already been applied to all pricing. So you don't need to enter a discount coupon code in your Cart or Checkout. Why This Matters- Software proficiency is a critical business skill.
- 95% of professionals underutilize Excel's potential.
- Advanced Excel and Power BI skills can significantly boost your market value.
Invest in your skills today, see the impact on your career tomorrow.
What People Say About Our CoursesIf you've never taken one of our courses before, check out what other people think of our training. 

We're honoured that people at companies like these have taken our courses. 
And we're grateful and humbled to be rated Excellent on Trustpilot. 
What You Get- Fast-track courses that quickly get you up to speed.
- In-depth syllabuses from beginner to advanced levels.
- Real-world examples for immediate implementation.
- Techniques to automate repetitive tasks and save hours.
- Personal support and mentoring - ask me questions and get support when you need it most.
Money Back GuaranteeDon't forget we offer a 30 day money back guarantee. So you can try our courses and if for some reason you don't
love them, we'll give you your money back. Click the Guarantee link for full details. Renewals and UpgradesThis discount applies to Renewals and Download Upgrades too. Existing customers can Renew and Upgrade from your Profile (make sure you login first). Which CourseWhether you're just starting with Excel or you're a seasoned professional, we've got a course for you. If you're not sure which course would suit you best, reply to this email and tell me a bit about your Excel and Power BI goals. I'm happy to help you find the course that will give you the biggest
bang for your buck. Kind Regards, Mynda Microsoft Excel MVP 
| | Dashboards provide insight, analysis and alerts by displaying key trends, comparisons and data in interactive reports. The reader can filter data and change views to find answers to their questions and problems. Read More
| 
| | Microsoft’s latest business intelligence (BI) & data visualization tool enables you to quickly develop stunning interactive dashboards. Embed Excel charts, tables, Pivot Tables and dashboards in your Power BI dashboards, then securely share your dashboards to any device. Read More
| 
| | Get quickly up to speed with Excel's functions. This course covers the fundamentals for each function, and less obvious uses for them. It's these more advanced techniques that will really set you apart
from the crowd. Read More
| 
| | Make huge efficiency gains by using dynamic named ranges to automatically update formulas, Pivot Tables and charts. Automate formatting like banded rows or columns; sorting and filtering; and totals and
statistics. Everything you need to work with Tables in less than 1 hour. Read More
| 
| | This short course will quickly have you building your own Pivot Tables with
confidence. Start with the ideal data layout for creating Pivot Tables. Then move on to formatting, aggregation, pivot charts, filters, slicers and much more. Read More
| 
| | Get data from almost any source (a database, the web, Excel, Sharepoint, Salesforce,
OData etc), then clean, transform, merge and append data to your query. Load the data into Excel or Power Pivot for analysis, report preparation or export. Read More
| 
| | Import millions of rows of data, create relationships between different data sources, and build interactive
reports. Quickly transform huge volumes of data into meaningful information to get the answers you need. Read More
| 
| | Designed to take you from zero to hero so you can confidently list 'Advanced Excel Skills' on your resume/CV.
Starting with the essentials, then covering must-know skills like best workbook design, advanced formulas, pivot tables, conditional formatting, macros and much more. Read More
| 
| | Learn the core concepts of the three primary financial
statements : Income Statement, Balance Sheet and Cash Flow Statement. By understanding core concepts you can avoid common mistakes when working with these three statements. This course breaks down the modelling process into small segments that are easily digestible. Read More
| 
| | Ideal for those involved in managing the daily operations of a business. Covering tasks such as calculating breakeven, optimizing shipping, allocating funds to maximize NPV/profit, or managing staff scheduling. Includes an introduction to Excel Solver and how to create Gantt Charts. Read More
| 
| | Learning to use Pivot Tables will allow you to quickly summarise and analyse large amounts of data - with just a few clicks of your mouse. Quickly transform data into meaningful information, and create reports that are easy to update and change. Read More
| 
| | Choose just one of these, or choose any combination of the three. Learn the core software tools any professional needs in a modern office environment. Read More
| 
| | Use Excel's existing tools to make business decisions under uncertainty by performing Monte Carlo simulations, using Decision Trees and Forecasting with the Data Analysis Toolpak. Ideal for executives,
analysts and all levels of business school students. Read More
| 
| | Designed for professionals working in customer service or call center environments. Efficiently and accurately collect and analyze data. Create forecasts and generate
clear, meaningful charts and reports. Boost your skills in handling customer service and call center information. Read More
| 
| | Leverage Excel tools for financial analysis including Time value of Money functions, What-If
analysis, Goal Seek, Amortization, Depreciation, and Solver Ideal for accountants, executives, analysts and all levels of business school students. Read More
| 
| | Statistics for the non-statistician. Quickly and efficiently calculate and report the
statistics of data and make decisions based on statistical output. Use the Excel Analysis Toolpak to generate descriptive statistics, histograms, correlations, regression, rank & percentile, random numbers, and sampling. Read More |
» GET THESE DEALS NOW |
|
|