Running Totals Made Easy
Previously, creating a running total measure involved multiple DAX functions, resulting in a complex formula like this.
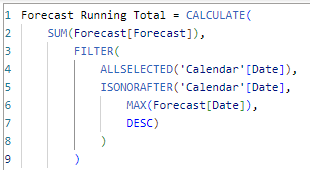
With the new Visual Calculations, it's much simpler:
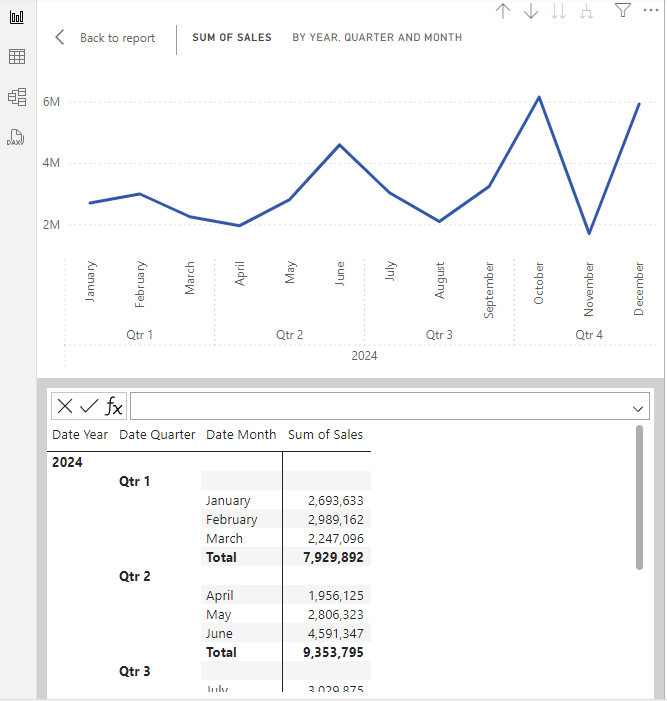
- Select the Visual: Choose the visual where you want to add the running total.
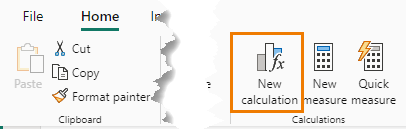
- New Calculation: On the Home tab, click 'New Calculation'.
- Open Visual Calculation Pane: This pane appears below the visual.
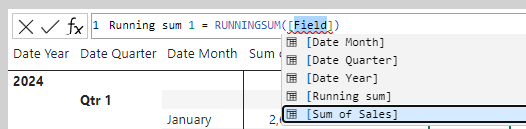
- Choose Template: Click 'fx' and select the Running Sum template:
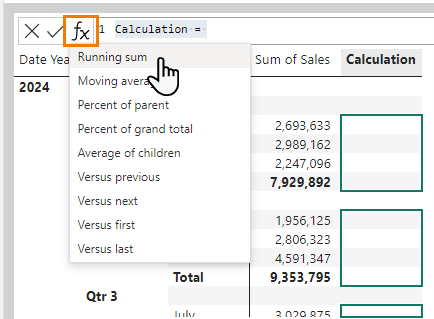
- Select Field: Choose the field for the running total from the available fields currently in the visual, e.g., Sum of Sales:
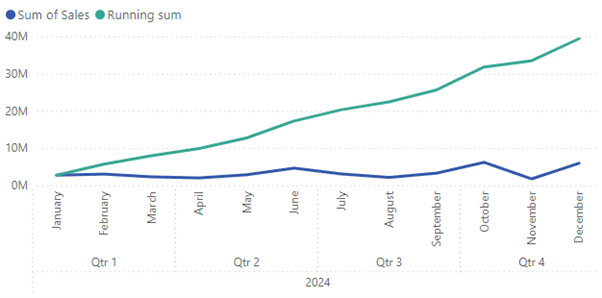
Press ENTER and just like that, you have a running total of sales by month in your visual:
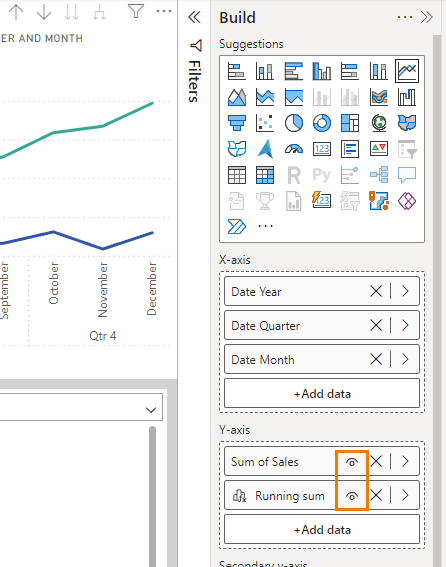
In the build pane, you can click the eye icon to hide the Sum of Sales if you only want to display the running total:
Simplifying Moving Averages
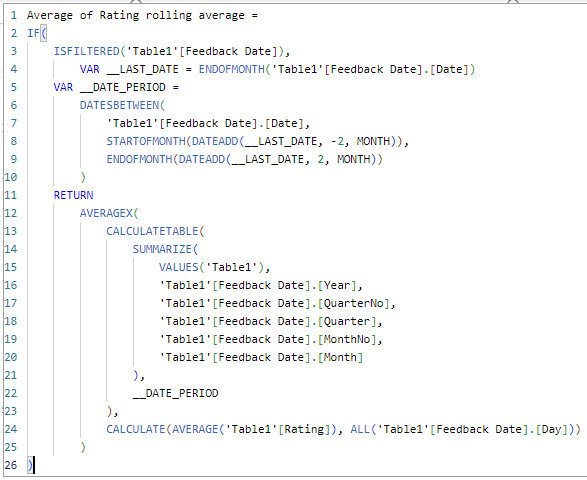
Another common yet complex calculation
is the moving average with a typical formula looking like this:
Visual Calculations make this straightforward:
- New Calculation: Click 'New Calculation' on the Home tab.
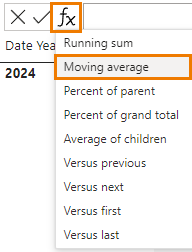
- Choose Template: Select the Moving Average template:
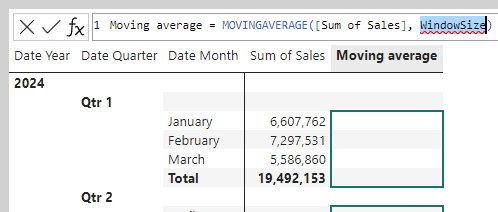
- Define Parameters: Input the field (Sum of Sales) and the window size, e.g., 3 for 3 months.
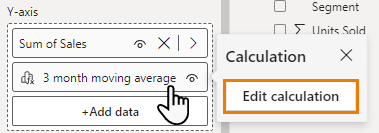
- Rename: Optionally, rename the measure to something like
"3-month moving average".
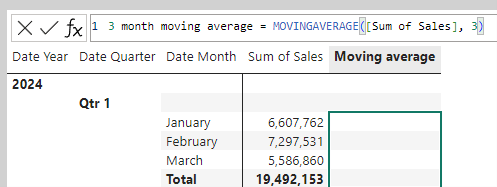
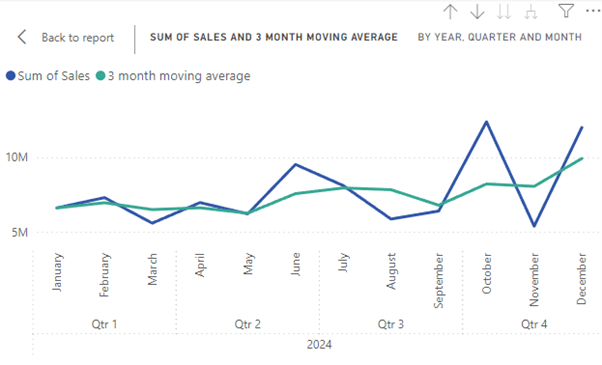
And there you have it - a moving
average in your visual:
To edit a visual calculation, simply click on
it in the Build field and select 'edit calculation'.
Custom Visual Calculations
Visual Calculations aren't limited to templates; you can also use many of the existing DAX functions combined with the new visual calculation functions.
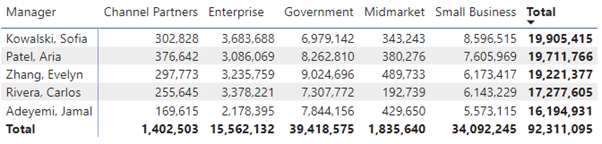
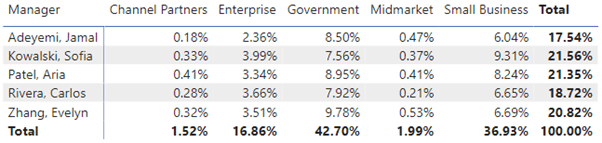
For example, to show sales as a percentage of the grand total in this matrix table:
- New Calculation: Add a new calculation from the Home tab.
- Define
Calculation: Use the following formula (or select the Percent of Grand Total template):
Percent of grand total = DIVIDE([Sum of Sales], COLLAPSEALL([Sum of Sales], COLUMNS, ROWS))
This calculates the percentage each value is
of the grand total:
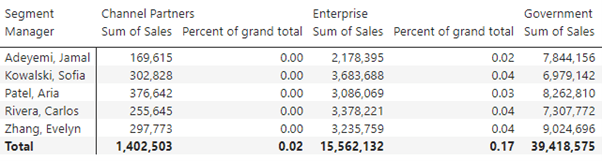
However, the percentages aren't formatted
correctly and because visual calculations don't appear in the field list, we can't apply formatting to them using the formatting tools on the Column Tools tab. The workaround is explained in the next step:
- Format: Edit the calculation to format the result as a percentage:
Percent of grand total = FORMAT(DIVIDE([Sum of Sales], COLLAPSEALL([Sum of Sales], COLUMNS, ROWS)), "0.00%")
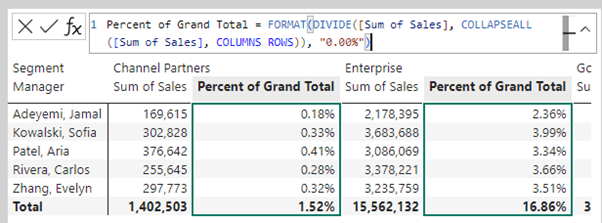
- Hide Sum of Sales: Hide the sum of sales values to clean up the visual.
New Visual Calculation Functions
Visual Calculations introduce a new set of functions to work within the confines of the visual matrix.
Currently these are the functions available:
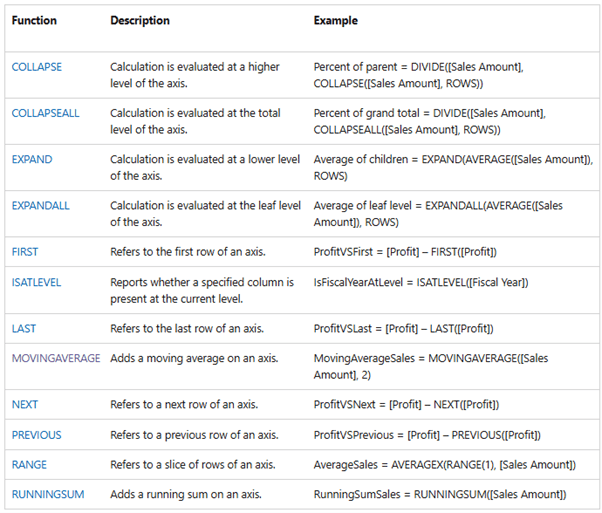
Check here for updates to the above list.
Limitations and Workarounds
While Visual Calculations are powerful, they have some limitations which may be resolved as they are further
developed:
- They are not added to the field list, meaning they can't be reused in other visuals.
- They cannot have number formats applied using the Column Tools. Instead, wrap the formulas in the FORMAT function.
- Conditional formatting cannot be
applied directly to visual calculations.
- To overcome the conditional formatting limitation, you can use the "Show Values As" feature to display values as a percentage and apply conditional formatting.
Enabling Visual Calculations
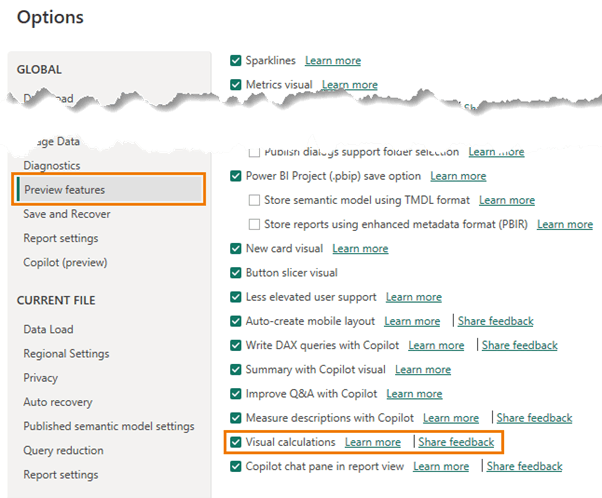
Visual Calculations are currently a preview feature. To enable
them:
- Update Power BI Desktop: Ensure you're running the latest version.
- Enable Feature: Go to File > Options & Settings > Options > Preview Features and check the box for Visual Calculations:
- Restart Power BI: Restart the application for the changes to take effect.
Next Steps
Microsoft's continuous improvements to Visual Calculations are making data analysis more accessible and powerful.
If you're an Excel user eager to elevate your data analysis skills, get up and running with Power BI by following my step-by-step guide to getting started with Power BI.
For more comprehensive learning, check out my Power BI, Power Pivot, and DAX course
bundle, designed to rapidly build your skills with practical examples and real-world projects.


