Rounded Chart Corners
Rounded corners are trendy, and you've probably noticed them on your phone's icons. However, by default, Excel charts have sharp, square edges.

But don't worry - you can round those corners with a few simple steps.
- Select your chart.
- Press CTRL + 1 to open the
formatting pane.
- Navigate to Fill & Line > Border > Rounded Corners.
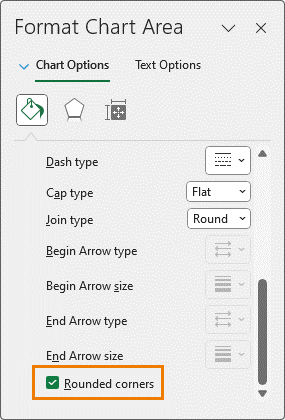
Just like that, your chart has a modern, smooth appearance. This works for both standard charts and Pivot Charts.

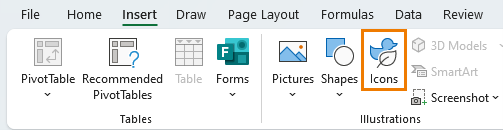
Using Icons for Better Visuals
Excel 365 offers a fantastic feature that allows you to insert icons directly into your spreadsheet. Icons not only make your reports more visually appealing, but they also help readers understand your data quickly.
- Go to the Insert tab
and click on Icons.
- You can search for the type of icon you need, such as "chart" or
"pizza," and insert it.
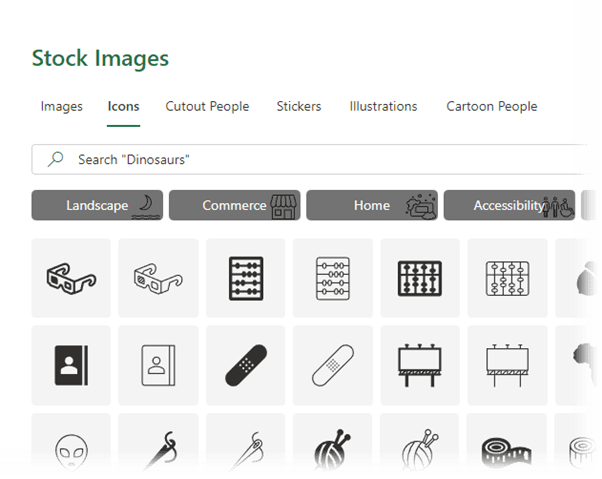
Icons in Excel are scalable objects, meaning you can adjust their size and placement as needed.
You can customize their file and line colour or if you want to customize them further, convert the icons to shapes.
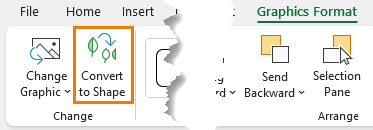
This allows you to color the individual components as you like, making your visuals truly unique.
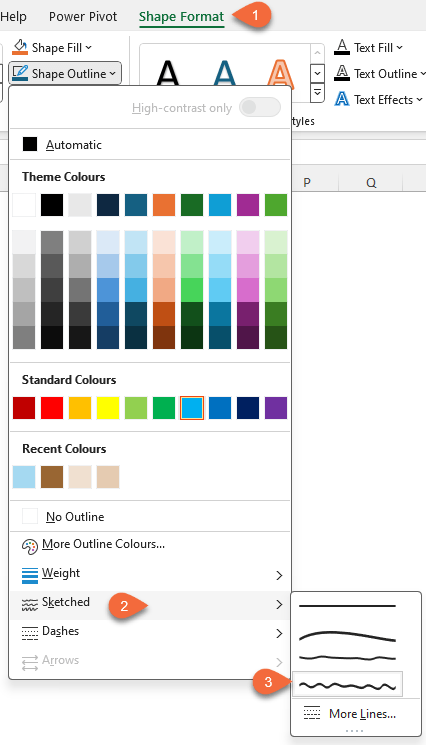
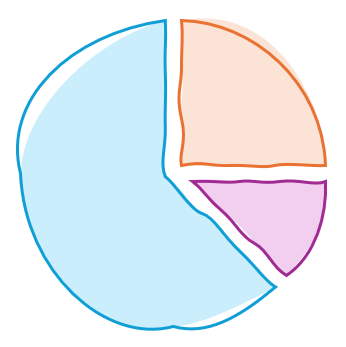
Tip: Try using a sketched outline for a hand drawn effect:
And mix it up with fill colours of a lighter shade for contrast:
Adding Shapes to Charts
Tired of boring column charts? You can spice them up with shapes! Instead of the typical solid bars, you can use custom shapes to
represent your data.
Here's how:
- First, split your data into two parts: the base value and the shape value.
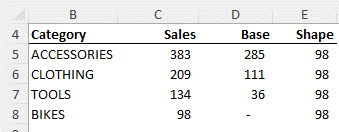
- Use the MIN formula for the shape part and subtract that from the total to get the base.
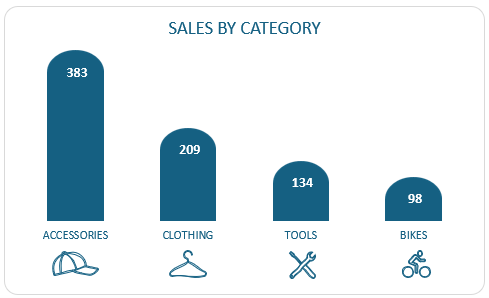
- Insert a stacked column chart and select a shape, like a flowchart connector, to represent the top series.
- Format the shape to match the column base, paste it over the top series, and your chart will instantly look more
engaging.
This method works well with a variety of shapes, but be mindful not to distort your data, making it harder to interpret.
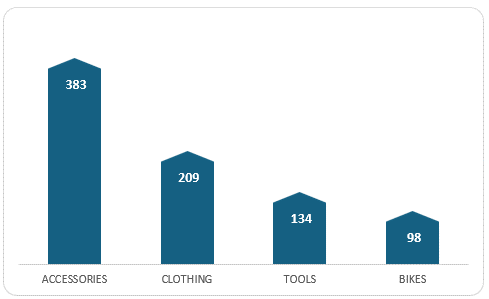
Tip: combine it with some icons for a more engaging chart:
Remove Image Backgrounds (No Photoshop Needed!)
Did you know that Excel can remove image backgrounds? Yes, you read that
right. You don't need fancy software to clean up images for your spreadsheet.

Here's how to do it:
- Insert your image into Excel.
- Go to the Picture Format tab and click Remove Background:
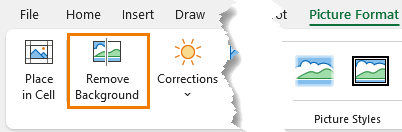
- Excel will automatically highlight the background areas in pink.

- Use the Mark Areas to Remove or Mark Areas to Keep tool to refine the image.
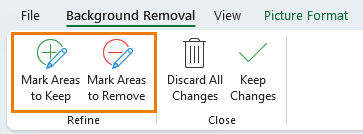
- When satisfied, click Keep Changes.
Now, you have a clean image ready for use! And if you want to save it for other applications, just right-click and select Save as Picture.
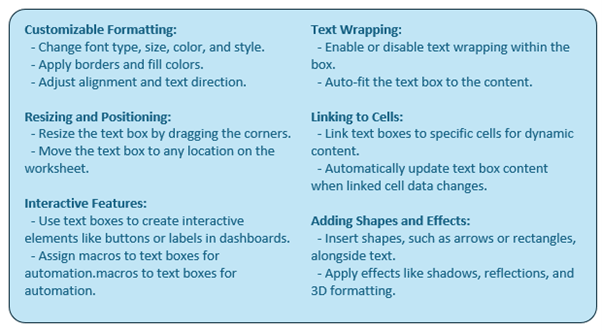
Multiple Columns in Shapes
Shapes are great for storing large amounts of text because they float above the grid, making them easy to position. But here's something many users overlook: you can format text inside shapes into columns!
- Select the shape and press CTRL + 1 to open the Format Shape pane.
- Under Size & Properties > Text Box,
you'll find the Columns option.
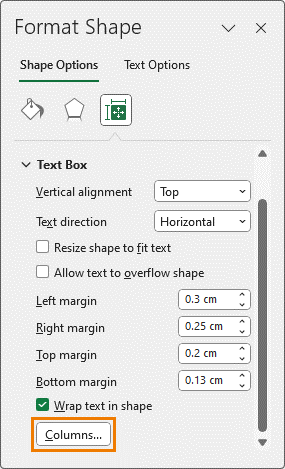
- Adjust the number of columns and spacing
as needed.
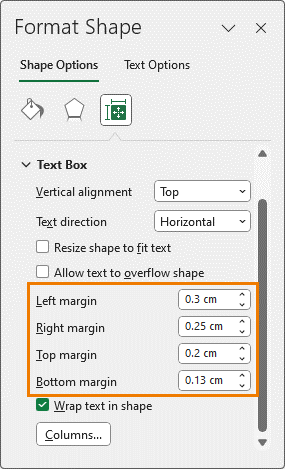
You can also tweak the text margins to get the perfect positioning. This is especially useful when you need to display large blocks of text in a tidy and organized manner.
Set Default Shape Formatting
If you find yourself repeatedly formatting shapes in the same way, save time by setting your own default shape formatting.
- Format a shape with your desired
settings (fill color, border, text columns, etc.).
- Right-click the shape and select Set as Default Shape.
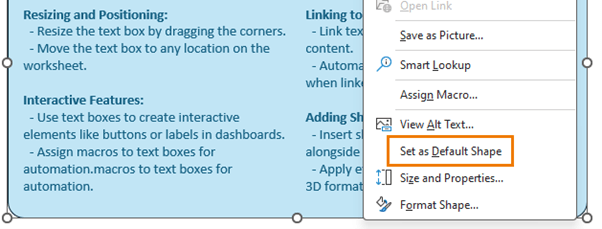
Now, every time you insert a new shape, Excel will apply your custom settings, saving you from having to manually adjust them over and over again.
Emojis in Sheet Tabs
Want to make your sheet tabs more fun and easier to navigate? Use emojis! They add a pop of color and can help differentiate your tabs at a
glance.
- To insert emojis, press Windows key + ; (semicolon) to bring up the emoji keyboard.
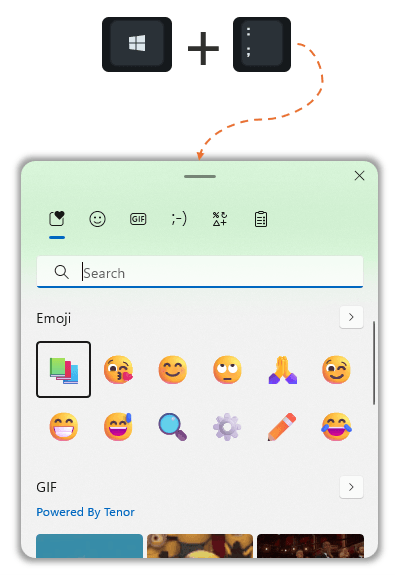
- Search for your desired emoji and insert it into the sheet tab name.
Tip: In Excel Online, these emojis even display in color, giving your workbook a modern and playful look.
Next Steps
These simple formatting tricks can dramatically improve the look and feel of your spreadsheets. Not only will they make your data more visually appealing, but they'll also enhance the readability and impact of your reports.
If you enjoyed these tips, check out my other post on 5 Hidden Excel Tools to Boost Your Productivity that will definitely change the way you work in Excel.
Feel free to share your favorite formatting hacks in the comments below!