Efficiencies gained from Power Query can be life changing. I’m not exaggerating.
Power Query can reduce time spent gathering and cleaning data by up to 99%!
Imagine if all you had to do was click a single button and all the boring and laborious data gathering and cleaning was done for you. What would you do with all that spare time?
However, a lot of people find
Power Query daunting, but it needn’t be. In this tutorial I’ll get you up and running with it in 3 easy steps.
Tip: Power Query is available in both Excel and Power BI, making these skills transferrable. I’m going to demonstrate it from the Excel interface, but it works the same in Power BI.
But better than that, it enables you to automate the gathering and cleaning of data.
Once you create a query it can be used again and again to gather and clean data with the click of a single button.
This means data gathering and cleaning tasks that you used to perform daily, weekly, or monthly can now be done with one click!
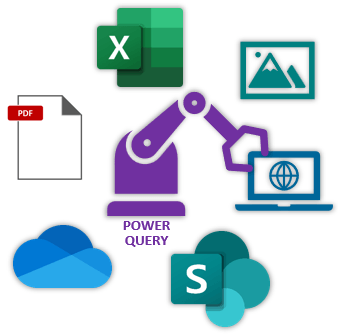
Power Query can get data from many different
sources including:
Excel, Text, CSV files
Web pages
Databases
Pictures
PDFs
SharePoint/OneDrive
And much more
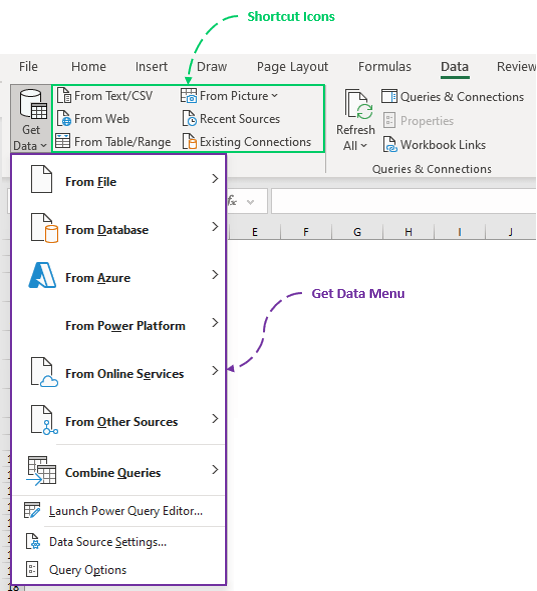
Step 1 – Get the Data
Use the Get Data menu on the data tab of the ribbon to specify where the data is you want to get, or use the shortcut icons:
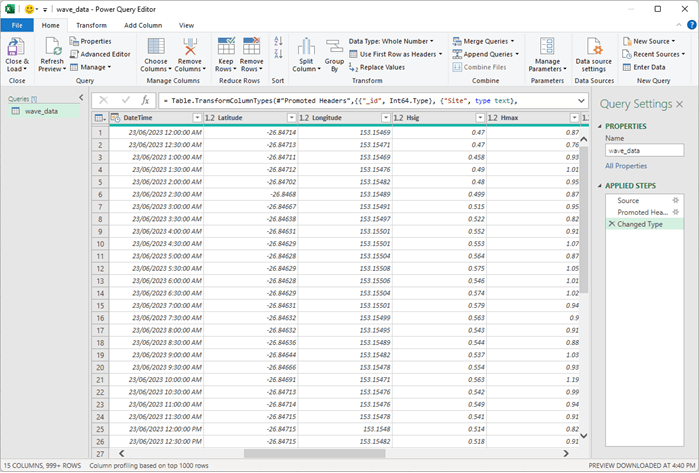
In this example I’ll connect to a CSV file that’s in a file on my PC. Once connected to the data source, the Power Query editor window opens and the first 999 rows* of the data are displayed:
* Power Query only displays the first 999 rows to enable it to be super responsive while you’re making transformations and working in
the editor. When you load the query, the full data set is loaded.
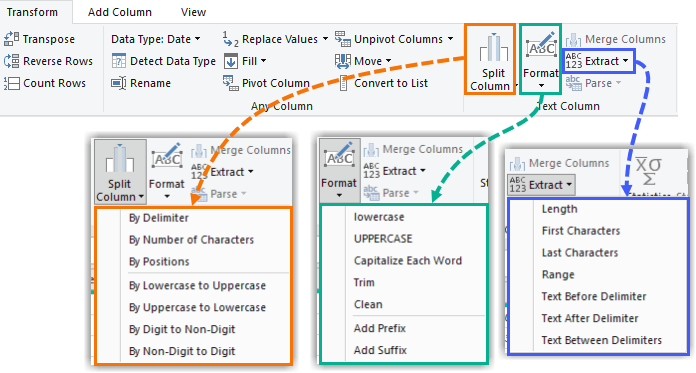
Step 2 – Clean the Data
The editor window is full of point and click icons for common data cleaning tasks. The Transform tab shown below contains just some of them:
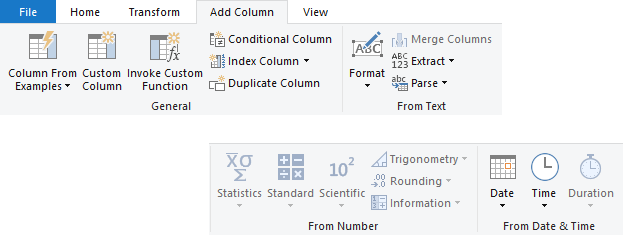
Another common data preparation task is adding columns with calculations and lookup formulas.
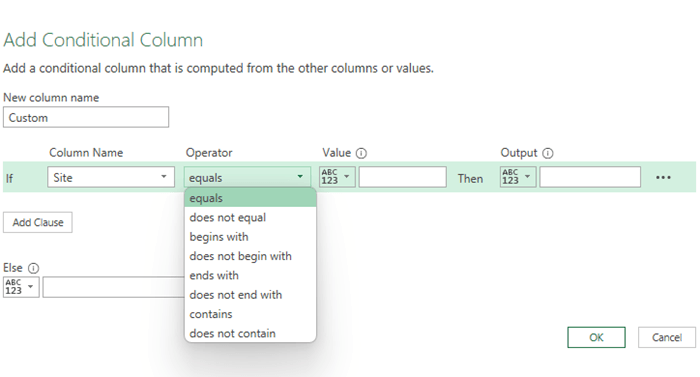
The Add Column tools enable you to write IF formulas with drop-down lists:
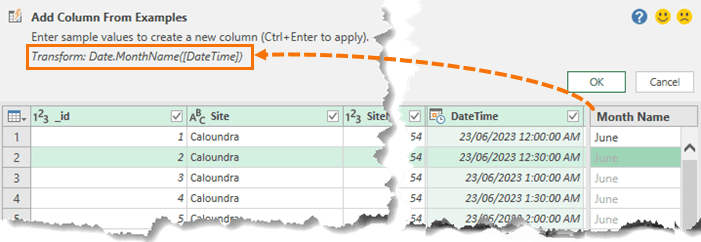
And the Column From
Examples tool uses AI to write formulas for you based on examples you give it.
For example, I want to add a column that contains the month name extracted from the DateTime field.
I simply type one or two examples, Power Query detects that I want the Month Name and writes a formula for me:
Check out the video above for more examples.
Step 3 – Load the Data
Once you have finished making the transformations, you’re ready to load the data to Excel or Power BI where you can begin analysing the data.
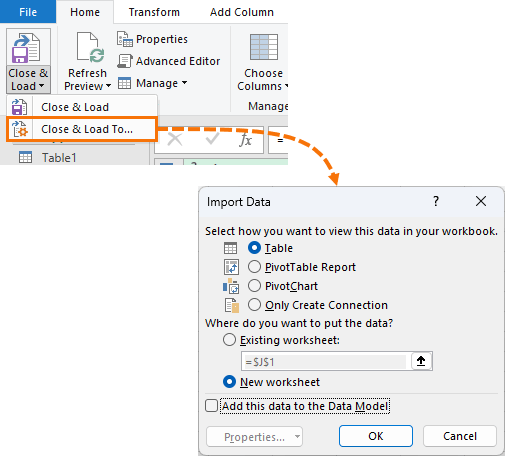
The first time you load a
query you can choose the Close & Load To… option which allows you to specify where you want to load it (you can change it later):
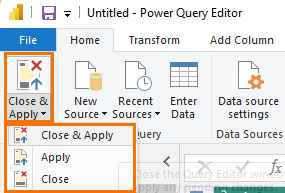
Note: in Power BI ‘Close & Apply’ loads the data to the Power Pivot data model:
What Power Query Isn’t Used For
A common misconception is that we use Power Query to analyse and format data. We don't.
The sole purpose of Power Query is to gather and clean data and load it to Excel or Power BI.
The analysis and formatting of the data into a report is done with formulas, PivotTables, charts/visuals etc. once you’ve closed & loaded the query.
Get Started with Power Query
Now that you see how easy Power Query is to use, I’m sure you’ll want to keep exploring. Check out the links below: