Data Analytics in Excel Study Path
Week 1 - Data Cleaning
The first goal is to tackle the essential skill of data cleaning because rarely do you get data that's error free and in the perfect format.
Tasks like removing duplicates, filling blank cells, unpivoting and more will be skills you need to master
and become efficient at.
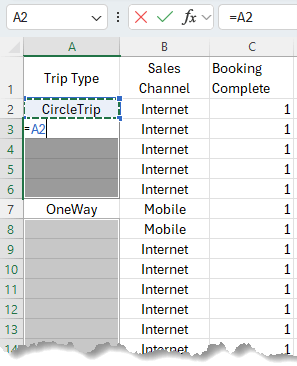
For example, below I've used the Go To > Special tool to select the empty cells in column A and then with a formula, I can reference the cell above to fill the blanks using CTRL+ENTER (see video for step by step and more data cleaning examples):
We can use various tools and formulas for one off data cleaning tasks and for more repetitive tasks you'll want to automate them, which I'll cover later.
Week 1 - Essential Functions
Next, you'll want to master statistical functions like COUNT, MAX, MIN etc. and more importantly, the conditional statistical functions like SUMFS and COUNTIFS etc.
Check out this video for more essential functions for data analysts, and those functions that everyone says you need to know, but you
don't:
Week 1 - PivotTables
PivotTables are one of the most powerful tools for a data analyst. They enable you to make light work of large datasets, extract insights, identify patterns and outliers with ease.
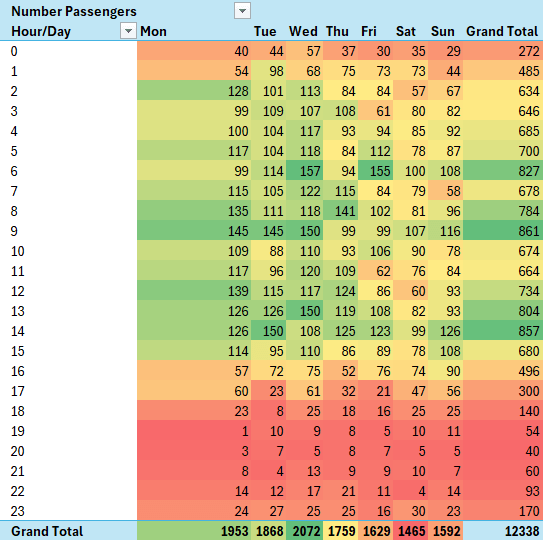
For example, in the PivotTable below that summarises flight booking data by hour and day of the week, we can easily see the peak and off-peak times:
Week 2 - Power Query
In the second week, you'll dive into more advanced Excel techniques. This is all about automating
repetitive tasks, working with larger datasets, and extracting more nuanced insights from your data.
Starting with the ability to efficiently connect to and analyse external data sources which is essential for staying competitive.
Excel's Power Query tool automates importing, cleaning and transforming data from a wide range of sources including
external databases, web pages or APIs, OneDrive, SharePoint, CSV or Excel files to name a few.
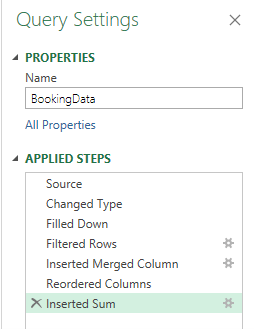
The image below shows the data cleaning and shaping steps Power Query automatically recorded, which will be automatically applied at the click of a button when you refresh the data:
The great thing about learning Power Query in Excel is these skills are transferrable to Power BI, which is another skill you'll need as a data analyst, so learning Power Query in Excel will be time well spent and will enable you to hit the ground running with Power BI.
Ready to Become a Data Analyst Today?
If you're ready to become a data analyst today I have courses on all the essential Excel skills such as Advanced Excel formulas, PivotTables, Power Query, Power Pivot, which we'll look at
next, and Excel Dashboards.
They take you on a logical path, with support from me when you need it, so you can confidently call yourself a data analyst.
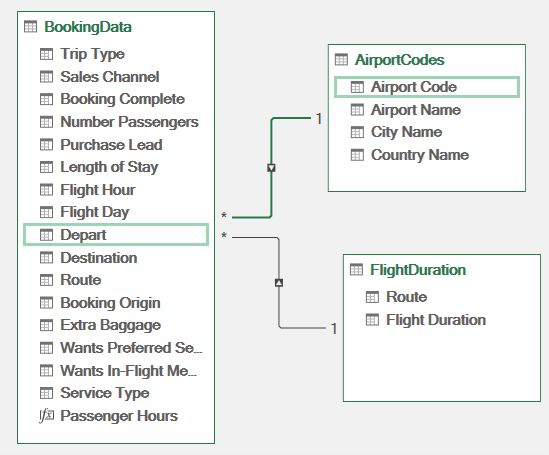
Week 2 - Power Pivot & DAX
Next on your journey to becoming a data analyst is Power Pivot & DAX.
Power Pivot enables you to model big data across multiple tables and the DAX formula language enables you to write advanced formulas to analyse the data in PivotTables. Power Pivot is also built into Power BI, so with Power Pivot and Power
Query skills you're two thirds of the way to mastering Power BI.
The image below shows the relationships between the three tables in a Power Pivot data model enabling you to analyse data across all tables in a single PivotTable:
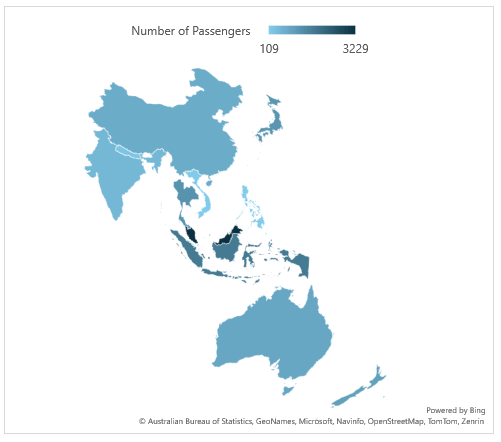
Week 3 - Data Visualisation
Effective data visualization involves using charts to represent our findings clearly and compellingly. For maximum efficiency, you'll want to create dynamic charts that align with your PivotTable analysis to visually communicate insights.
For example, the map chart below visually represents the number of passengers originating each country:
From here the next step is to master dynamic dashboards that enable your stakeholders to make business decisions at a glance.
Week 4 - Application to Real-word Scenarios
To truly master Excel for data analytics, the next step is to immerse yourself in practical projects as much as
possible.
Set up a structured practice routine with a different type of data to analyze each day. For instance, one day could be dedicated to financial data, another to social media metrics, and so on. The aim is to challenge yourself with different data types and analytical problems to broaden your skills.

There are many great resources for free datasets you can use to practice, including Kaggle.com, Data.World, Google Dataset Search and
more.
However, the limitation with these datasets is they don't give you any practice at cleaning data, which will be one of the main aspects of your role. For that you can join online Excel forums like ours that has a dedicated group for Power Query
where people share data files and real-world questions.
Forums will also give you the opportunity to learn from others as you browse through past questions that have been answered.
Next Steps
Get started mastering these essential skills with our courses:
Tip: you can get the Power Query, Power Pivot and Excel Dashboard courses in discounted bundle from the Excel Dashboards course page. And
the Excel Expert course includes Advanced Formulas and PivotTables, as well as many other essential Excel skills.
Once you've mastered data analytics in Excel, you'll be ready for Power BI for data visualization.
According to Gartner Research, Power BI is the leading BI tool on the market and an essential skill for data analysts.
Remember, having already learned Power Query and Power Pivot with DAX in Excel,
you'll hit the ground running with Power BI.