|
|
Excel Fun Unleashed! ✨🚀
Ever felt like your Excel tabs are looking a bit too formal or BORING? Let's spice them up! 🌶️🔥
👉 Here’s the Secret: Windows Key + Semi-Colon
From there, you can pick your favorite emojis and insert them directly into your Excel sheet tab names. It's an instant mood booster and a great way to categorize or prioritize your
work. 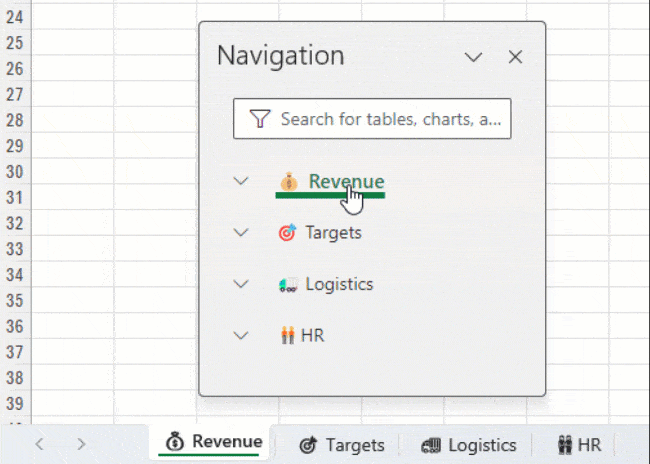
💡Tip: Open the Navigation pane via the View tab to see the sheet names and emojis in color. 👀 This nifty trick isn't just about adding fun to your spreadsheets. It's about:
1. Efficiency: Visual cues like emojis can help you navigate between tabs faster.
2. Communication: Add a bit of character when sharing sheets with colleagues.
3. Brevity: consider just using emojis without the text.
4. Personalization: Make your work
environment more you.
|
After completing some action like deleting a row or applying formatting, press F4 to do it again. This works with lots of things, give it a go and see for yourself. |
|
Data
spread across multiple sheets is an Excel crime! Thankfully Power Query can easily merge data from multiple sheets into one table. |
|
Choose any of our courses and get 20% off all of them from now until November 30th. Scroll down to see a list of courses or click the button below.
Buy one course, buy two, or buy them all, it's up to you. This discount applies to Renewals and Download Upgrades too. Existing customers can Renew and Upgrade from your Profile (make sure you login first). Click on Read More
below each course description to get more information and pricing for that course. No coupons required, the prices are already discounted. Simply add the courses to your shopping cart.
|
Mynda Treacy Microsoft MVP Co-Founder My Online Training Hub
|
Excel DashboardsDashboards provide insight, analysis and alerts by displaying key trends, comparisons and data in interactive reports. The reader can filter data and change views to find answers to their questions and problems. Read More >
Power BIMicrosoft’s latest business intelligence (BI) & data visualization tool enables you to quickly develop stunning interactive dashboards. Embed Excel charts, tables, Pivot Tables and dashboards in your Power BI dashboards, then securely share your dashboards to any
device. Read More >
Advanced Excel FormulasGet quickly up to speed with Excel's functions. This course covers the fundamentals for each function, and less obvious uses for them. It's these more advanced techniques that will really set you apart from the crowd. Read More >
Excel TablesMake huge efficiency gains by using dynamic named ranges to automatically update formulas, Pivot Tables and charts. Automate formatting like banded rows or columns; sorting and filtering; and totals and statistics. Everything you need to work with Tables in less than 1
hour. Read More >
Pivot Tables : Quick StartThis short course will quickly have you building your own Pivot Tables with confidence. Start with the ideal data layout for creating Pivot Tables. Then move on to formatting, aggregation, pivot charts, filters, slicers and much more. Read More >
Power QueryGet data from almost any source (a database, the web, Excel, Sharepoint, Salesforce, OData etc), then clean, transform, merge and append data to your query. Load the data into Excel or Power Pivot for analysis, report preparation or export. Read More >
Power Pivot & DAXImport millions of rows of data, create relationships between different data sources, and build interactive reports. Quickly transform huge volumes of data into meaningful information to get the answers you need. Read More >
Excel ExpertDesigned to take you from zero to hero so you can confidently list 'Advanced Excel Skills' on your resume/CV. Starting with the essentials, then covering must-know skills like best workbook design, advanced formulas, pivot tables, conditional formatting, macros and much
more. Read More >
Excel VBAAre you tired of spending hours on tedious, manual tasks in Excel? Do you want to boost your productivity and take your skills to the next level? If you're nodding your head, then you're in the right place.
Learn Excel VBA and save hours
of time even if you have zero prior experience with programming. Read More >
Office Scripts for ExcelUnlock the power of automation in Excel 365 without any prior programming knowledge.
Whether you're using Windows, Mac, or Excel Online, boost your productivity, automate Excel, and run tasks while you
sleep! Read More >
Financial ModelingLearn the core concepts of the three primary financial statements : Income Statement, Balance Sheet and Cash Flow Statement. By understanding core concepts you can avoid common mistakes when working with these three statements. This course breaks down the modelling
process into small segments that are easily digestible. Read More >
Excel for Operations ManagementIdeal for those involved in managing the daily operations of a business. Covering tasks such as calculating breakeven, optimizing shipping, allocating funds to maximize NPV/profit, or managing staff scheduling. Includes an introduction to Excel Solver and how
to create Gantt Charts. Read More >
Pivot TablesLearning to use Pivot Tables will allow you to quickly summarise and analyse large amounts of data - with just a few clicks of your mouse. Quickly transform data into meaningful information, and create reports that are easy to update and change. Read More >
Excel, Word & OutlookChoose just one of these, or choose any combination of the three. Learn the core software tools any professional needs in a modern office environment. Read More >
Excel for Decision MakingUse Excel's existing tools to make business decisions under uncertainty by performing Monte Carlo simulations, using Decision Trees and Forecasting with the Data Analysis Toolpak. Ideal for executives, analysts and all levels of business school
students. Read More >
Excel for Customer ServiceDesigned for professionals working in customer service or call center environments. Efficiently and accurately collect and analyze data. Create forecasts and generate clear, meaningful charts and reports. Boost your skills in handling customer service and call
center information. Read More >
Excel for FinanceLeverage Excel tools for financial analysis including Time value of Money functions, What-If analysis, Goal Seek, Amortization, Depreciation, and Solver Ideal for accountants, executives, analysts and all levels of business school students. Read More >
Excel Analysis ToolPakStatistics for the non-statistician. Quickly and efficiently calculate and report the statistics of data and make decisions based on statistical output. Use the Excel Analysis Toolpak to generate descriptive statistics, histograms, correlations, regression, rank &
percentile, random numbers, and sampling. Read More >
This email may contain affiliate links. This means I may earn a commission should you choose to make a purchase using my link. But we only promote courses we believe will benefit you. |
|
|
|
|
|