|
|
In case you missed it, Python is now available in Excel. Currently it is limited to people using Microsoft 365 Office Insider on the Beta Channel so join Office Insider to get access to it. Now is the time to learn Python and get ahead of the game before it's on general release to all Excel users. We've partnered with PyFi to offer you two
Python courses that will teach you the skills you need to make the most of Python in Excel. PyFi is a company that specializes in Python courses for financial professionals and have trained staff at companies like Goldman Sachs, Credit Suisse and KPMG, to name drop just 3 - there are plenty
more. But even if you don't work in a financial environment, their Python Fundamentals course will teach you what you need to get started analyzing data and creating amazing charts with Python. Learning Python for use in Excel will become a highly sought after skill. So much so that JP Morgan have said they will be training every new analyst and associate in Python. If you want to learn skills that will help
you gain promotions and a better salary, check out these courses.
Python Fundamentals Course
This course is for you if you want to take your first steps into the world of Python. It is designed for you if you are:
- An Early-Career Finance Professional: You want to stand out in the industry and are looking for a promotion, a raise, or a better job.
- A Finance Student: You want to secure an internship or
build your resume for your post-grad job.
- Technically-Minded & Analytical: You are a logical problem solver and an analytical thinker.
- Familiar with Excel: You are comfortable working with spreadsheets.
- New to Python: You have never coded in Python before, or you want to review the basics before moving on to more advanced material.
- Ready to Grow: You are not afraid to dive in and learn something new.
Python Applied Machine Learning Course
An advanced course for those working in areas like banking, sales, trading, capital markets or asset management. This course applies machine learning to
build investor classifiers and solve real problems in the world of finance. When you finish this course you will have a practical understanding of how machine learning is used in the finance industry, and you will be able to create new algorithms of your own from scratch
You can buy the courses separately or buy both in a bundle and save. Click the button below to check out the bundle pricing
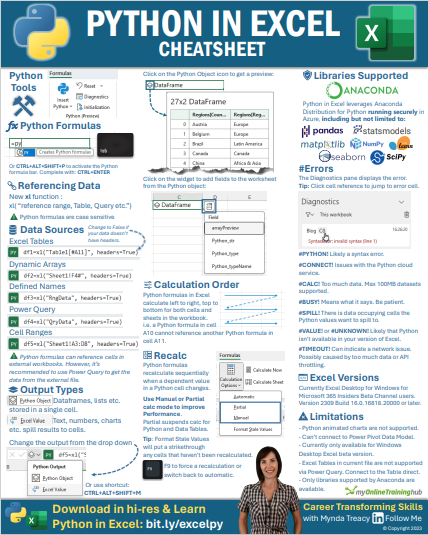
Python in Excel + Cheat Sheet
|
If you haven't already read our blog about the amazing things you can do in Excel with Python then >> Read the Blog Here << While you are there you can download a copy of our handy Cheat Sheet that gives you everything you need to know about getting started with Python in Excel. Click the button below
to download the Cheat Sheet in HI-RES.
|
Learn to use Python libraries like NumPy, Pandas Seaborn and MatPlotLib to analyze your data and create amazing
charts.
|
Mynda Treacy Microsoft MVP Co-Founder My Online Training Hub
|
Excel DashboardsDashboards provide insight, analysis and alerts by displaying key trends, comparisons and data in interactive reports. The reader can filter data and change views to find answers to their questions and problems. Read More >
Power BIMicrosoft’s latest business intelligence (BI) & data visualization tool enables you to quickly develop stunning interactive dashboards. Embed Excel charts, tables, Pivot Tables and dashboards in your Power BI dashboards, then securely share your dashboards to any
device. Read More >
Advanced Excel FormulasGet quickly up to speed with Excel's functions. This course covers the fundamentals for each function, and less obvious uses for them. It's these more advanced techniques that will really set you apart from the crowd. Read More >
Excel TablesMake huge efficiency gains by using dynamic named ranges to automatically update formulas, Pivot Tables and charts. Automate formatting like banded rows or columns; sorting and filtering; and totals and statistics. Everything you need to work with Tables in less than 1
hour. Read More >
Pivot Tables : Quick StartThis short course will quickly have you building your own Pivot Tables with confidence. Start with the ideal data layout for creating Pivot Tables. Then move on to formatting, aggregation, pivot charts, filters, slicers and much more. Read More >
Power QueryGet data from almost any source (a database, the web, Excel, Sharepoint, Salesforce, OData etc), then clean, transform, merge and append data to your query. Load the data into Excel or Power Pivot for analysis, report preparation or export. Read More >
Power Pivot & DAXImport millions of rows of data, create relationships between different data sources, and build interactive reports. Quickly transform huge volumes of data into meaningful information to get the answers you need. Read More >
Excel ExpertDesigned to take you from zero to hero so you can confidently list 'Advanced Excel Skills' on your resume/CV. Starting with the essentials, then covering must-know skills like best workbook design, advanced formulas, pivot tables, conditional formatting, macros and much
more. Read More >
Financial ModelingLearn the core concepts of the three primary financial statements : Income Statement, Balance Sheet and Cash Flow Statement. By understanding core concepts you can avoid common mistakes when working with these three statements. This course breaks down the modelling
process into small segments that are easily digestible. Read More >
Excel for Operations ManagementIdeal for those involved in managing the daily operations of a business. Covering tasks such as calculating breakeven, optimizing shipping, allocating funds to maximize NPV/profit, or managing staff scheduling. Includes an introduction to Excel Solver and how
to create Gantt Charts. Read More >
Excel VBAAre you tired of spending hours on tedious, manual tasks in Excel? Do you want to boost your productivity and take your skills to the next level? If you're nodding your head, then you're in the right place.
Learn Excel VBA and save hours of time even if you have zero prior experience with programming. Read More >
Pivot TablesLearning to use Pivot Tables will allow you to quickly summarise and analyse large amounts of data - with just a few clicks of your mouse. Quickly transform data into meaningful information, and create reports that are easy to update and change. Read More >
Excel, Word & OutlookChoose just one of these, or choose any combination of the three. Learn the core software tools any professional needs in a modern office environment. Read More >
Excel for Decision MakingUse Excel's existing tools to make business decisions under uncertainty by performing Monte Carlo simulations, using Decision Trees and Forecasting with the Data Analysis Toolpak. Ideal for executives, analysts and all levels of business school
students. Read More >
Excel for Customer ServiceDesigned for professionals working in customer service or call center environments. Efficiently and accurately collect and analyze data. Create forecasts and generate clear, meaningful charts and reports. Boost your skills in handling customer service and call
center information. Read More >
Excel for FinanceLeverage Excel tools for financial analysis including Time value of Money functions, What-If analysis, Goal Seek, Amortization, Depreciation, and Solver Ideal for accountants, executives, analysts and all levels of business school students. Read More >
Excel Analysis ToolPakStatistics for the non-statistician. Quickly and efficiently calculate and report the statistics of data and make decisions based on statistical output. Use the Excel Analysis Toolpak to generate descriptive statistics, histograms, correlations, regression, rank &
percentile, random numbers, and sampling. Read More >
This email may contain affiliate links. This means I may earn a commission should you choose to make a purchase using my link. But we only promote courses or things we believe will benefit you. |
|
|
|
|
|