Creating a Personal Budget Template
Step 1: Identify the types of income and expenses you have
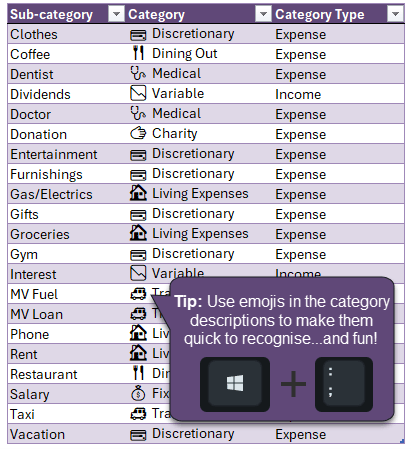
- List them in column labelled sub-category.
- Then add a column to organise the sub-categories into larger Category groups. This will help you analyse your spending.
- Lastly, add a column to tag the categories as Expense or Income.
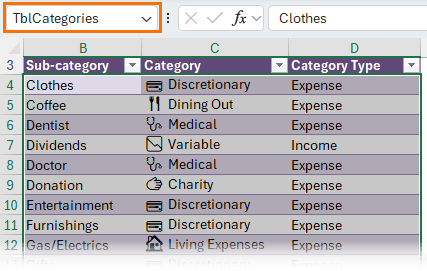
- Format
the data in an Excel Table (CTRL+T) so it's easy for Excel to reference and any sub-categories you add are automatically available elsewhere in your template.
- Rename this table: TblCategories:
Step 2: Define a Named Range for the Subcategories
Select the Sub-category cells in the table > Formulas tab > Define Name. I've named mine 'subcategories' and you can see it refers to the table's 'Sub-category' column:
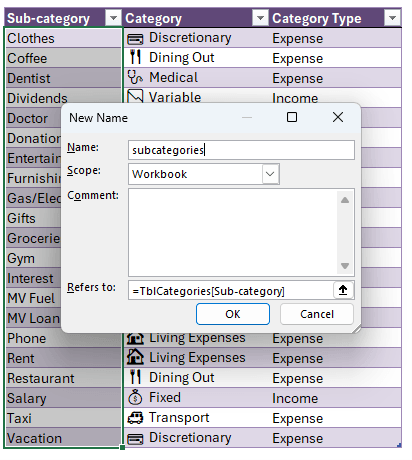
Note: in earlier versions of Excel you cannot use the table's structured references in the 'Refers to' field. Instead see
this post on Excel Tables as a Source for Data Validation Lists for a solution.
Step 3: Prepare your budget
On a new sheet create a table that estimates values for each
income and expense subcategory by month:
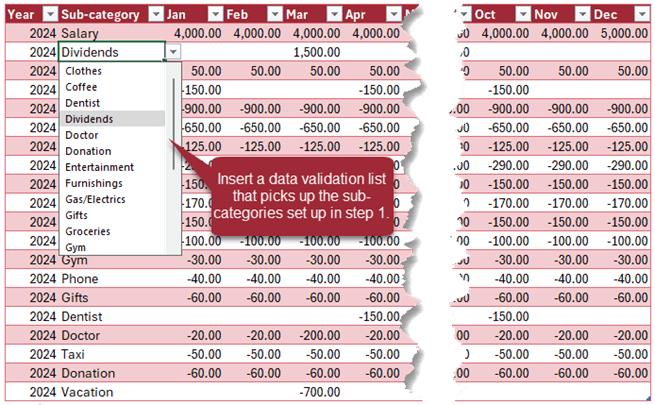
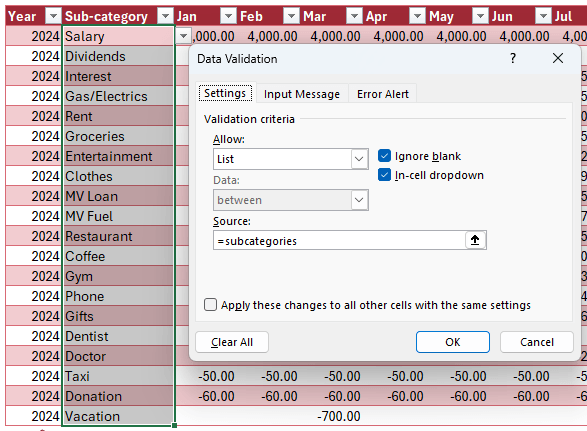
To insert a data validation list, select the cells in the sub-category column of your budget table > Data tab > Data Validation. In the dialog box select 'List' from the 'Allow' drop down menu and in the 'Source' field insert the name of your sub-category list you defined in step
2:
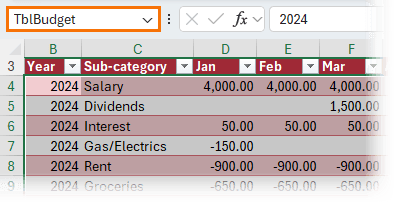
Rename this table, TblBudget:
Tip: Tables are a great way to improve
productivity because they make it quick and easy for Excel to reference your data in formulas and PivotTables. When new data is added to a table it's automatically included in anything referencing it, you don't have to edit any references to them. There are a load more useful features available with Tables. Get up to speed with my Excel Tables
course.
Step 4: Track your actual income and expenses
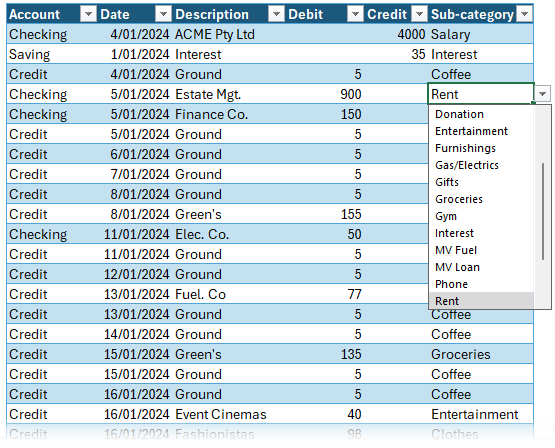
Copy and paste the transactions from your bank statement into a new table. Add the Account and sub-category for each line. Again, use a data validation list for the sub-category field to ensure you have a consistent list of sub-categories.
Remember a
Debit is money you spend. i.e. the bank debits your account. A Credit is money you receive e.g. the bank credits your account when you receive your salary.
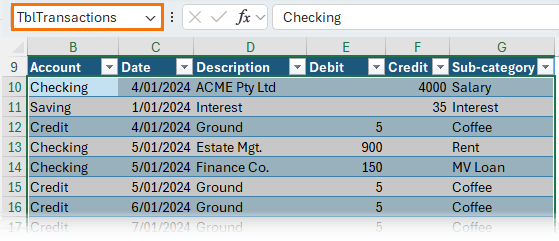
Rename this table, TblTransactions:
Note: if you don't intend to build this budget file for yourself, you can skip this next section and jump to Step 10.
Step 5: Prepare Data
This will enable you to
perform calculations on the data without needing formulas that have the potential to break. It sounds scarier than it is, but trust me, this is easy and will make your report bullet proof.
The last thing you want is a formula error telling you that you have more money than you do!
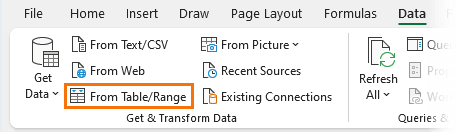
Select the first table, then
on the Data tab of the ribbon > From Table/Range:
Then from the Power Query editor window Home tab > Close & Load to… > Only Create Connection:
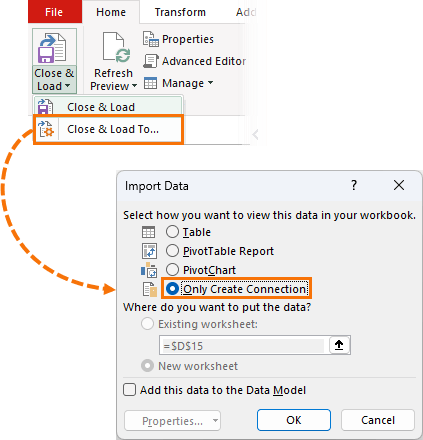
Repeat for the Budget and Transactions Table.
Step 6: Create the Data table
In this step we'll merge the actual and budget amounts into one table and add columns for the Category and Category types to facilitate the reports that will give you
insights to your spending.
Note: For detailed step-by-step instructions, see the video above.
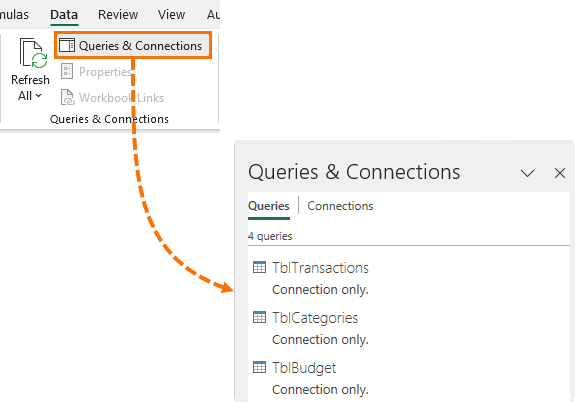
Open the Budget query created in the previous step. Go to the Data tab > Queries & Connections. This opens a task pane on the right. You should have 3 queries listed,
one for each of your tables:
Step 7: Clean and Transform the Data
Step 7.1: Starting with the Transactions query, we need to perform the following steps:
- Replace the 'null' values in the Debit & Credit columns with 0
- Add a column to merge the debits and credits into one column and convert the debit amounts to negative values.
- Remove the Debit & Credit columns, as these are no longer required.
We could have done this with formulas, but like I said, formulas are easily broken.
Step 7.2: Next, go to the Budget query and perform the
following steps:
- Unpivot the month columns
- Merge the Month name and Year columns and name the new column, Date
- Convert the Date column to a 'date' data type
- Rename the 'Value' column to 'Budget'
This converts the Budget table into the correct tabular layout required to quickly and easily analyse data in Excel.
Step 7.3: Lastly,
append the transactions and budget queries together into a new table (Append > as new).
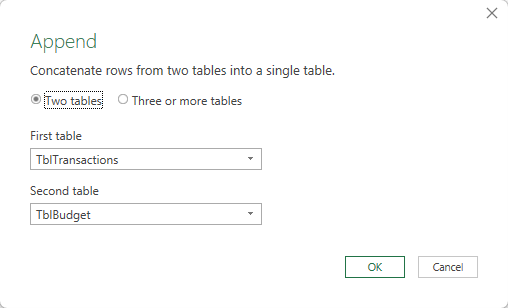
This new query
table will be called 'Data'.
Then merge the Data table with the Categories table to bring in the Category and Category Type fields:
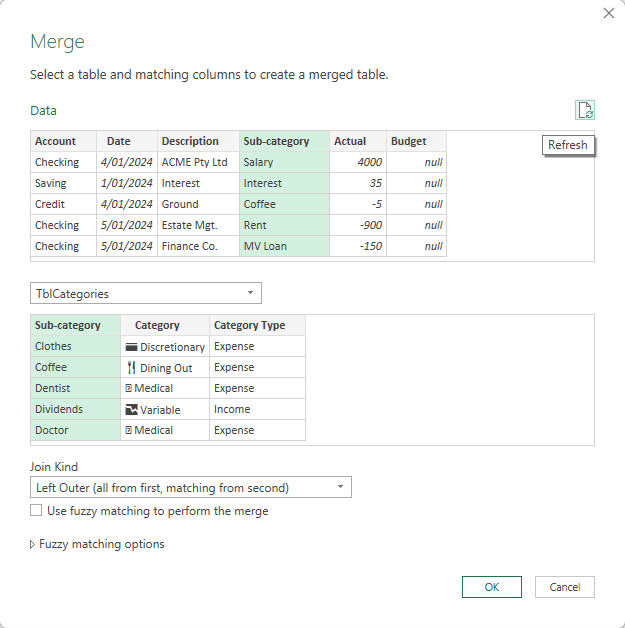
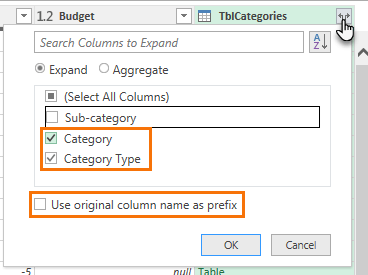
Expand the TblCategories column to bring in the Category and Category Type fields:
Tip: this is the equivalent of a VLOOKUP or XLOOKUP!
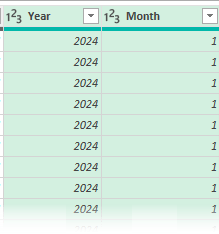
To support the reports, I'll add columns for the year and month numbers. Note: this is because I can't group the dates in the PivotTable
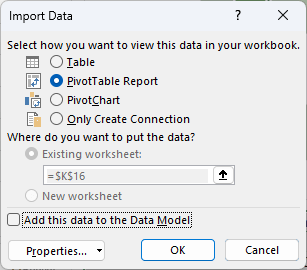
This time I'll Close & Load to… > a PivotTable report.
Tip: 10x
productivity and automate more of your boring data gathering and cleaning tasks with Power Query. Get up to speed with my Power Query course.
Step 8: Analyse & Visualise the Data
Now that
you've done the hard work of preparing a budget and entering your actual income and expenses, it's time to track how you're doing.
It's super rewarding to see your spending come under control and your savings grow right before your eyes.
You can use PivotTables to summarise your data and compare your actual results to your budget. See the video above for
step-by-step instructions.
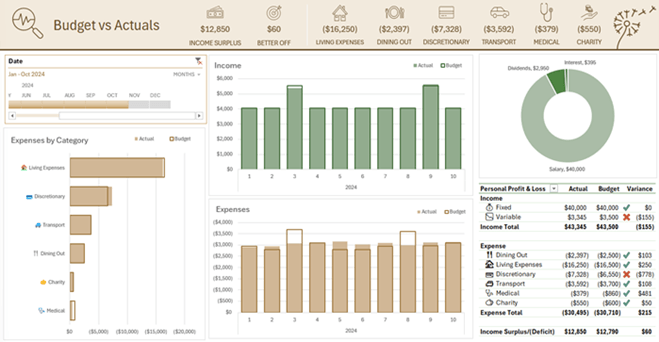
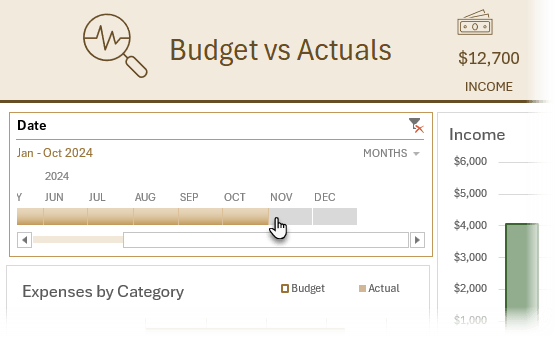
Headline figures give you an up to date view of your position by category and whether you're over or under budget overall:

Use Icons to visually represent the different key figures making them quick to identify and interesting to look at.
Expenses by Category using a bar chart enables you to see which
categories are over or under budget and the size of spend in relation to other categories:
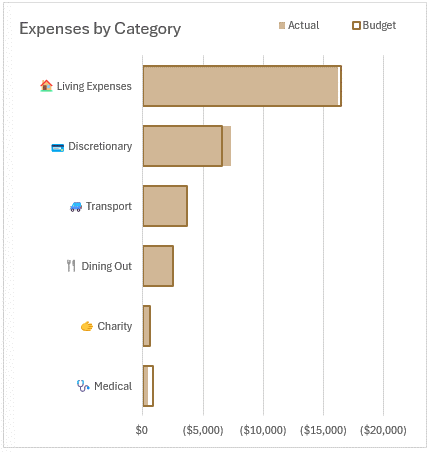
Notice the emojis feed through to the chart axis labels? see, I told you it would be fun!
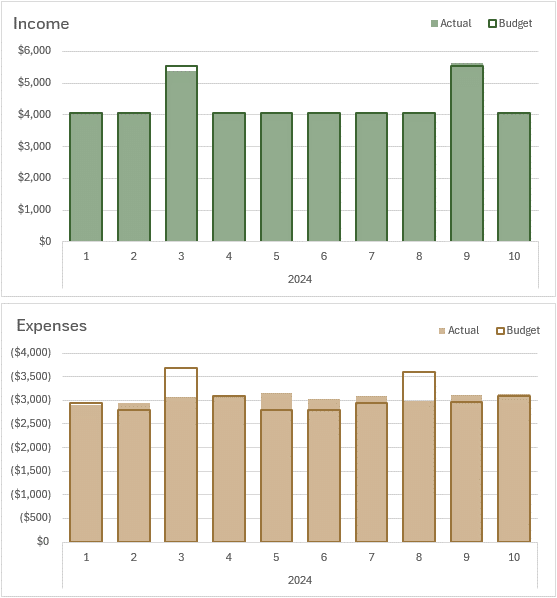
Income and expenses by month allow you to see which months are over or under budget and any trends in your spending which will help you budget in future years:
Income by category allows you to see what proportion each income stream
is of your total income. The more you can diversify your income, the less risk you have if any one income stream reduces:
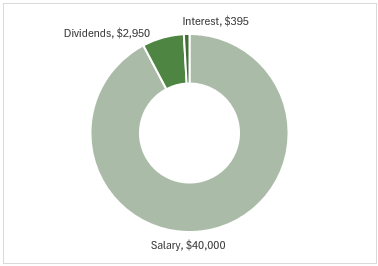
Diversification tip: get a side hustle!
Your Personal Profit and Loss statement allows you to see how each category is performing and your overall position:
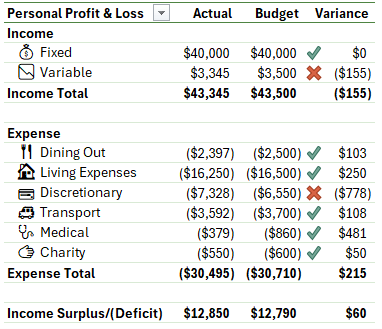
Conditional formatting gives you visual indicators for each category.
Tip: double click on any of the values in the Profit and Loss statement to see the underlying transactions.
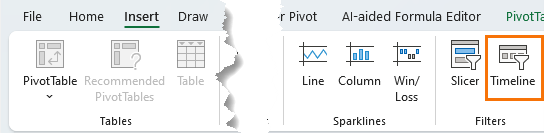
Lastly, insert a Timeline Slicer to filter the charts and visuals for the periods you want to focus on:
Tip: you can use these skills to wow your colleagues at work with interactive reports. Get your skills up to speed quickly with my Excel dashboard course.
Automate Gathering Transactions
To further automate maintaining your budget report, you can use Power Query to gather your bank transactions.
A lot of banks will export transactions to CSV or Excel files and we can use Power
Query to automatically get those files from a folder and merge then into a table.
So, check out this Combine Files From a Folder tutorial next.
Video: Combing Files from a
Folder