Data Cleaning with Flash Fill
Flash Fill uses a form of machine-learning techniques to automatically reformat data based on one or two examples you give it.
Flash Fill can work with text strings, dates, numbers and more. It’s perfect for cleaning up one off messy data. If you need to repeat the cleaning regularly with the same data, you’re better off using Power Query’s Column From Example. More on that later in this tutorial.
See all the Flash Fill examples in the video below:
Tip: use the keyboard shortcut keys: CTRL+E to trigger Flash Fill. Want more keyboard shortcuts? Get our 239 Excel Keyboard Shortcuts PDF.
Data Cleaning with Power Query Column from Example
Similar to Flash Fill, in Power
Query’s add a column from example enables you to you give it a few examples of the result you want, and it will write a formula that adds the column:
What’s
great about this is if your data being referenced by Power Query changes, you can simply click the Refresh button on the Data tab, and it’ll update it.
For a comprehensive tutorial, see my Power Query Add Columns From Example post or watch the main video at the top of this email.

Formula Writer/Excel Labs
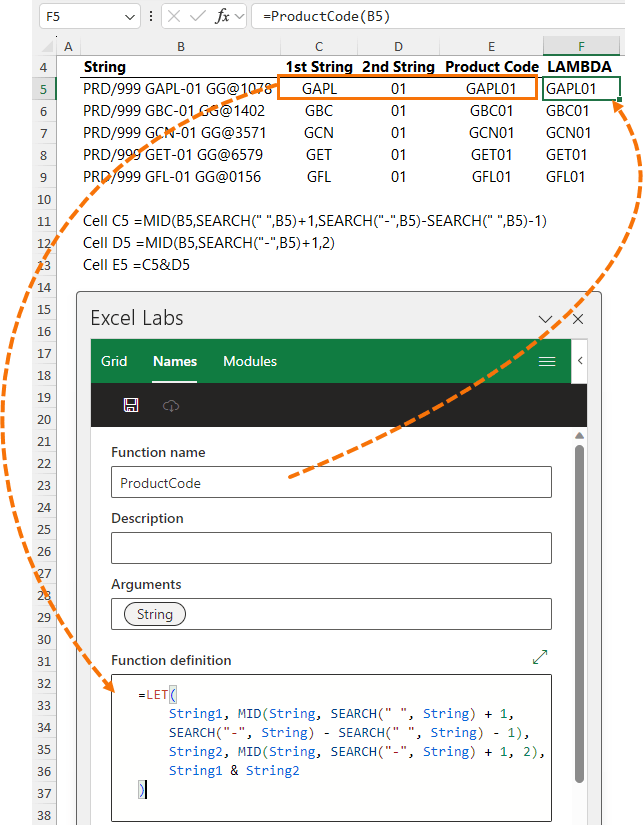
Excel Labs, formerly called the Advanced Formula Environment, is a new improved formula bar. Not only can you write formulas and have them nicely formatted, you can define names, and it can convert formulas to custom LAMBDA
functions from examples in the grid.
Strictly speaking, this could fall under data analysis or data cleaning as formulas can be written to do either.
In cells C5:E5 I have three separate formulas to extract the Product Code from the string in column B. Using Excel Labs, I can convert those three formulas into a single LAMBDA formula with the click of a button for use again and again:
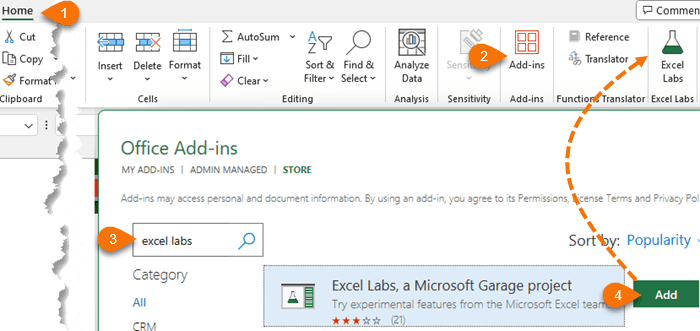
Excel Labs is a free add-in made by Microsoft available to Microsoft 365 users via the Home tab > Add-ins:
For more on Excel Labs, check out the video below (note: at the time of recording, Excel Labs was called the Advanced formula Environment).

Formula by Example
We can now have Excel write formulas for us, simply give it some examples
of the results you want, and Excel will write a formula for you. Much like Flash Fill, except better because formulas will automatically update as the data changes:
It’s currently only
available in Excel Online for all US English users of Microsoft 365, with a Personal or Family subscription and requires the data to be in an Excel Table. Check out the video below for more examples:
Data Analysis with Recommended PivotTables
If you’re not sure how to analyse your data or
you’re new to PivotTables and Charts, recommended PivotTables will analyse your data and make some suggestions:
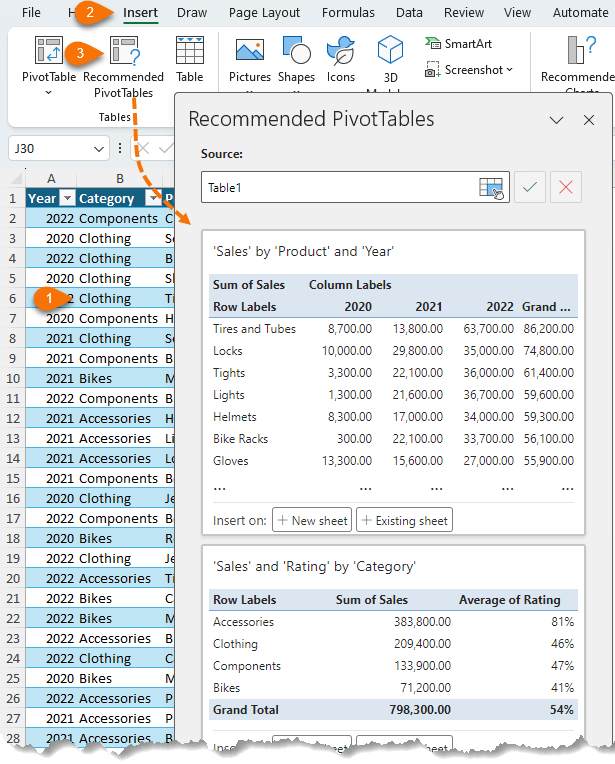
You can click on the ‘insert’ buttons at the bottom of each
PivotTable in the Preview pane to add the suggested PivotTable to a new or existing sheet. From there you can work with them like any other PivotTable, changing and rearranging fields, formatting etc.
Data Analysis with Recommended Charts
Similarly, Recommended Charts will make suggestions based on your data. Depending on the data, they can be Pivot Charts or regular charts:
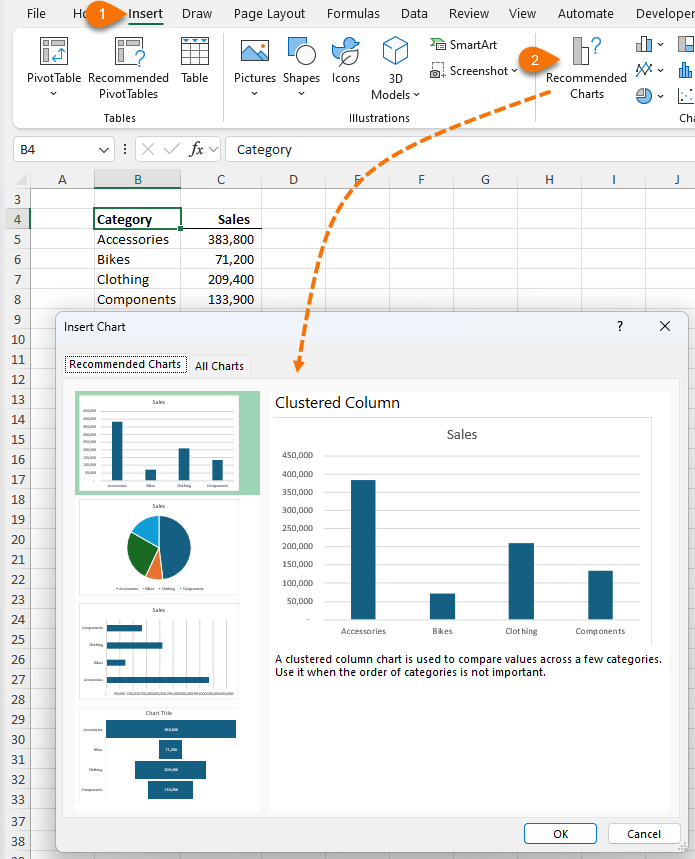
Select the chart from the left list of previews to get a closer look, and then click “OK” to insert it in the workbook. From there you can modify the chart like any other.
Data Analysis with Analyze Data
Analyze Data, formerly called ‘Ideas’, is an AI powered service that automatically identifies patterns in your data and provides you with charts and PivotTables you can insert into your workbook. You can also ask it questions of your data and get answers in the form of
PivotTables and Charts.
And because it is powered by machine learning it will provide increasingly advanced analysis as usage grows.
I like to use Analyze Data when I receive a new dataset that I’m not familiar with. It’s great to get an insight into trends, patterns, outliers, and the type of data I’m working with.
Using Analyze Data
Ideally, your data should be in a tabular layout and formatted in an Excel Table. The more category type columns in your dataset the more opportunities Excel has to group the data and find interesting
correlations, trends and patterns.
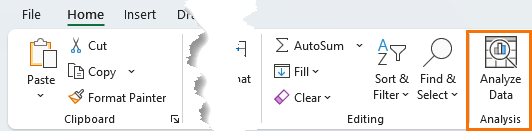
You’ll find Analyze Data on the Home tab of the ribbon:
The Analyze Data pane will open containing suggested
PivotTables, Charts and analysis:
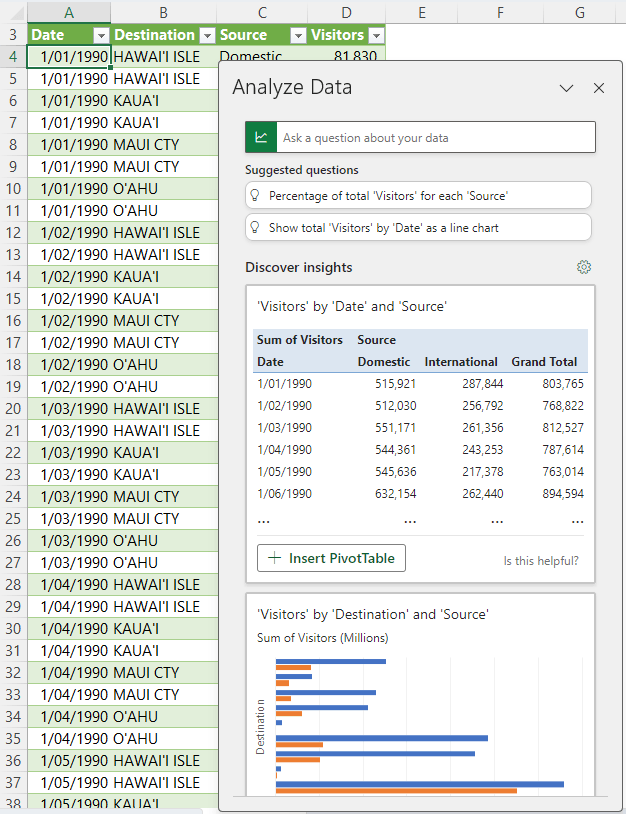
Click the + button at the bottom of each insight to insert them into your workbook.
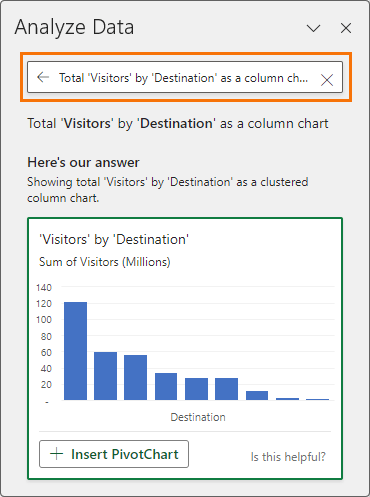
Or using natural language you can ask
it a specific question. In the example below I’ve asked it to display the total visitors by destination as a column chart. The result is a PivotChart I can insert into my workbook:
Forecasting
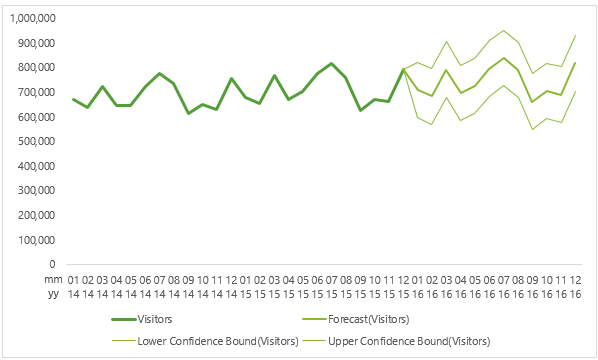
Excel Forecast sheets automatically generates formulas to predict the future values and present the results in a chart.
Forecast sheets require historical time-based data in a tabular layout that contains a column with dates/times at consistent intervals and a column for the values.
Note: Your date/time data
can be missing up to 30% of the data points or have several numbers with the same time stamp. Excel will average the data with the same time stamp. However, summarizing data before you create the forecast will produce more accurate forecast results.
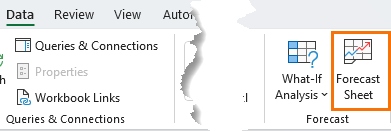
Creating a forecast is easy via the Data tab > Forecast Sheet:
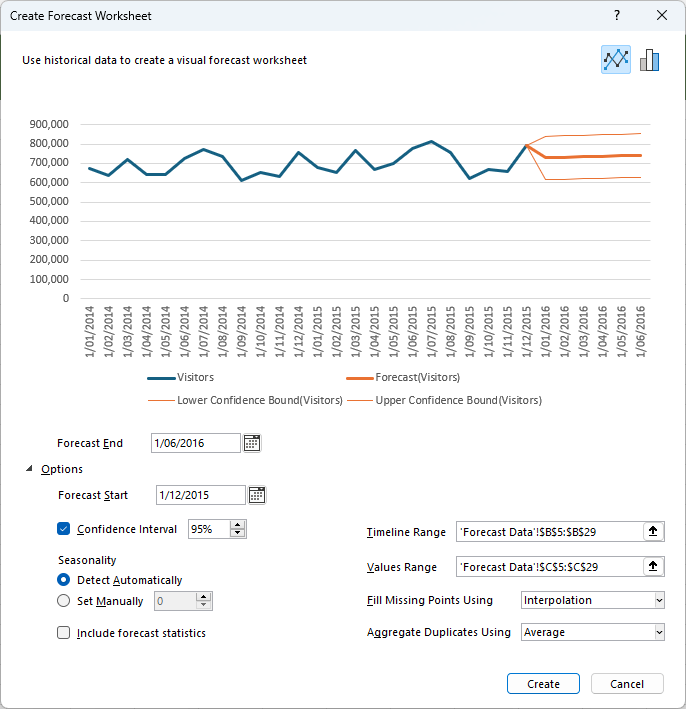
At the dialog box you can set confidence intervals, seasonality, and various other settings:
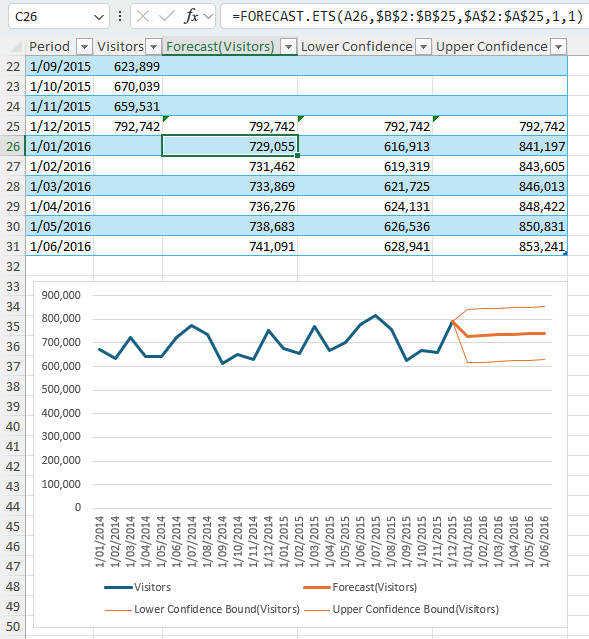
Clicking ‘Create’ inserts a new sheet in the file containing a copy of your data, the formulas and a chart:
For step by step instructions and an explanation of the options, see the video below: