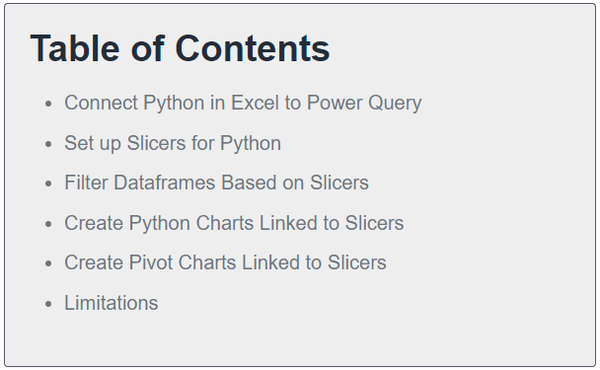
Connect Python in Excel to Power Query
For this example, I’ll connect Python to Power Query data, which is currently only supported for external data sources. i.e., you can’t connect Python in Excel to a query that references data in an Excel Table in the same file, yet!
To create a Python dataframe connected to Power Query, simply type =PY or use the keyboard shortcut CTRL+ALT+SHIFT+P then enter the following
Python formula:
DataframeName = Xl("Query Name", headers=True)Note: Python formulas are case sensitive.
Then CTRL+ENTER to complete the formula.
As shown in the image below where my query is called QryEmployeeData:

Tip: Watch the video above to see step by step how to create the query.

Set up Slicers for Python
In this example I need a Slicer for the Education Level. The Slicer selection feeds into the Python formula in Excel to filter the dataframe before loading the data to the Python chart.
In the image below I’ve created a new dataframe df2 from the PivotTable and then converted it into a list of Education Levels:

Filter Dataframes Based on Slicers
The list created in the previous step is used to create a new dataframe called filtered_df1which is based on the original dataframe df1, and will contain the Employee Data filtered for the Education Levels selected in the Slicer:
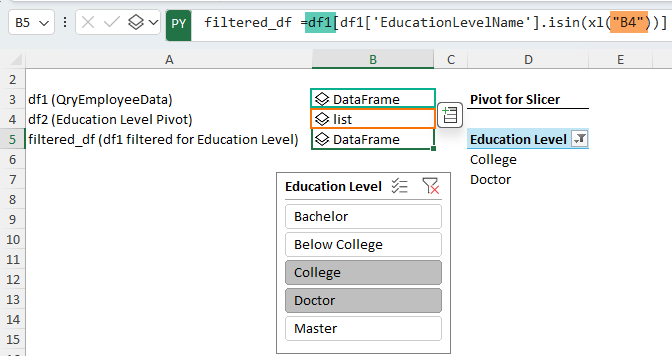
Note: I could have done all this filtering in the original dataframe, but then I couldn’t ever use that
dataframe in any other analysis or charts in an unfiltered state.
Create Python Charts Linked to Slicers
For this example I’m using a Seaborn Scatterplot with varying point sizes and
hues.
It references the dataframe on the ‘Workings’ sheet in cell B5, which contains the filtered results called filtered_df1 based on the Slicer selections:

Create Pivot Charts Linked to Slicers
Next, I copied the PivotTable that captures the Slicer selection and pasted it for the Excel Pivot Chart.
By copying it, the connection to the Slicer is maintained, enabling
the Slicer to now filter both the Python chart and the Pivot Chart.

Note: I could have
loaded the Power Query data direct to a Pivot Chart, but I like to build the PivotTable first as it’s easier to set sort orders and number formats.
Next, insert a Pivot Chart and format accordingly:
Tip: if you forget to copy the PivotTable and instead insert a new PivotTable, right-click on the Slicer > Report Connections > select the PivotTables from the list that you want the Slicer to filter.
IMPORTANT: For the Slicer to filter both PivotTables, they must use the same source data Table.
Limitations
Slow Files
Refreshing Python formulas can be slow to recalculate. You may find it helpful to set calculation to Partial while writing Python in Excel:

Partial Calculation puts Python and Excel Data Tables into Manual calc mode. Press F9 to force a manual calculation.
Tip: Format Stale Values will put a strikethrough any cells that haven’t been recalculated.
Python Animations
Currently Python charts like
these that use Python code for animations and interactivity are not supported in Excel.