Learn How to Use Python in Excel
Excel Python Function
Python is written in a new Excel function, PY. Typing =PY > Tab, puts the formula bar into Python mode with a green banner to the left:

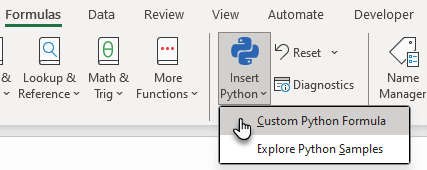
You can also switch the formula bar into Python mode via the Formulas tab > Insert Python > Custom Python Formula:
Python functions are completed with CTRL+ENTER.
How to Import Python Libraries to
Excel
The first thing you’ll want to do is import the libraries you want to use in the file.
Simply list them by specifying:
import LibraryName as LibraryShortName
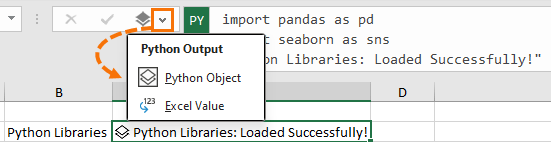
For example, in the screenshot below I’ve imported Pandas, Seaborn and Matplotlib:
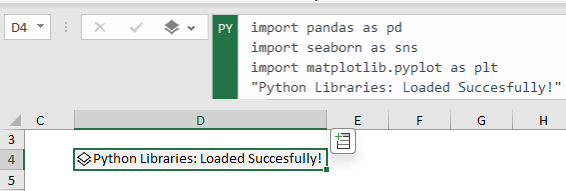
Finish with the text you want to display when the libraries have loaded and press CTRL+ENTER to complete the formula.
Tip: if the cell doesn’t display the Python Object symbol, choose it from the drop down beside the formula bar:
Defining Python DataFrames in Excel
Next, you’ll want to load your data to a DataFrame.
DataFrames are defined with a new function called xl.
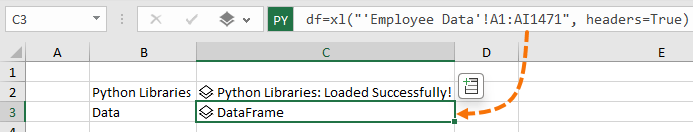
To use it, prefix the formula with the dataframe name, this is often simply df:
DataFrameName = xl("cell range", headers=True/False)
In the image below you can see I’ve named my DataFrame df
and it’s on a sheet called ‘Employee Data’ in cells A1:AI471:
Note: There is flexibility on how you use DataFrames in Excel, you can refer to them by name e.g.
df['HourlyRate'].plot()
or simply by using the cell reference e.g.
xl("C3")['HourlyRate'].plot().
Tip: You don’t have to place the Python Libraries and DataFrame in separate cells to the Python code, but by doing so, you make them available in other Python formulas in the workbook.
Because Python cells calculate in row-major order (left to right, top to bottom), the Dataframe must be defined in a cell above the cell containing a Python formula that
references it.
This concept applies to different Sheets as well, going left to right. Globals also work across different sheets (left to right).
Python Descriptive Statistics in Excel
Now that we’ve imported the Python libraries and defined the
DataFrame, we’re ready to analyse the data.
Let’s start with some descriptive statistics using Pandas.
In a cell below the DataFrame cell, I can simply enter a Python formula.
Remember to start a Python formula enter =PY and tab, then enter the following
code:
df.describe()
And CTRL+ENTER to complete it.
Alternatively, if your DataFrame is on another sheet, as mine is, you can reference the sheet and cell containing the DataFrame with the xl function like so:
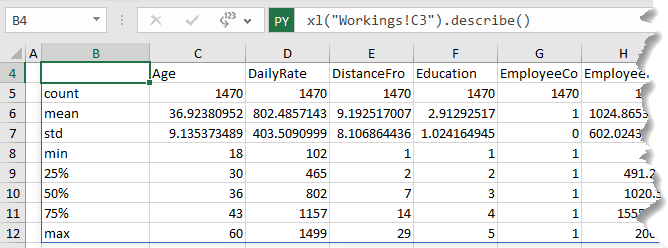
Python returns descriptive statistics for all numeric columns in the DataFrame.
Python Plots in Excel
Charts, or Python plots as they’re known, can be created in a Python formula and the resultant plot is displayed in a single cell.
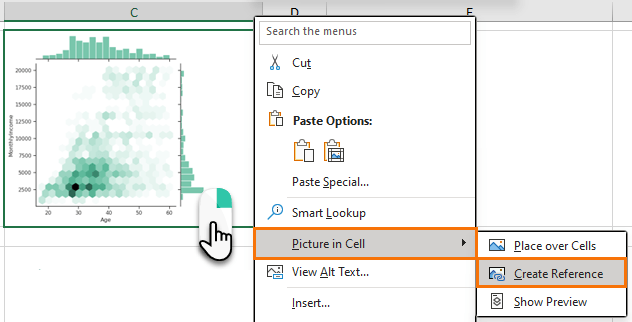
In the image below I’ve created a Seaborn Hexbin JointPlot.
You can see it references the DataFrame with the Age field on the X axis and MonthlyIncome on the Y axis:

Of course, it’s not much use storing charts in a single cell.
We can merge multiple cells to give them more space, but merged cells are a
pain.
Instead, it’s better to use the image tools to create a linked picture of the chart that we can move to other sheets in the file:
This picture can then be resized to suit your report requirements or even copied to PowerPoint or Word etc.
For more chart examples, download the file from the link above.
Generate Code with
ChatGPT
We’ve looked at using Python in Excel to return statistics and plots (charts), but there are many uses for Python in Excel.
But most Excel users like me, aren’t Python programmers, I’ve never written Python code before writing this post.
So, I turned to ChatGPT-4 for
help.
If you’re not familiar with Python, try using ChatGPT-4 with Code Interpreter turned on:
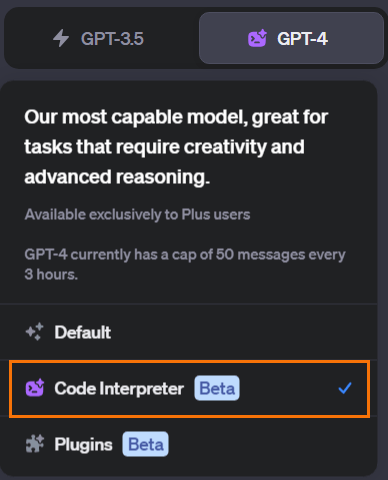
Or if you don’t have a GPT-4 subscription, you can use Bing Chat in Creative mode:

Excel Python Errors & Troubleshooting
Python cells return the last assignment or last expression.
If None is returned, you will see the value 0 in a cell.
There are also a few errors you’re likely to experience:
#CONNECT! Means there are issues with the Python cloud service. If you see this error, click the Reset button in the formulas tab or press CTRL + SHIFT + ALT + F9 to restart the Python Session.
#CALC! This
error occurs when Excel's calculation engine encounters an unspecified calculation error with an array. Try restarting the Python session with CTRL + SHIFT + ALT + F9.
#BUSY! Means what it says. Stay patient and it should eventually calculate.
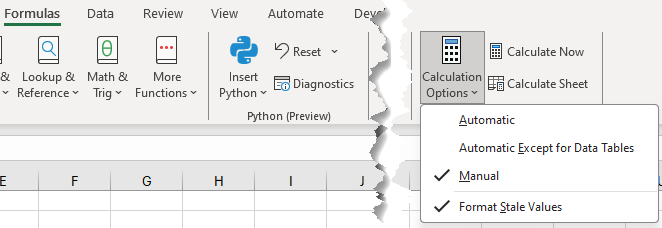
Tip: whenever a Python formula is entered, it triggers all Python code in the file to recalculate.
You may find it better to turn calculation mode to manual while working in files containing a lot of Python.
Format Stale Values will put a strikethrough any
cells that haven’t been recalculated:
#EXTERNAL! Or #VALUE! Means there’s something wrong with your code. You can check the Diagnostics pane via the Formulas tab:
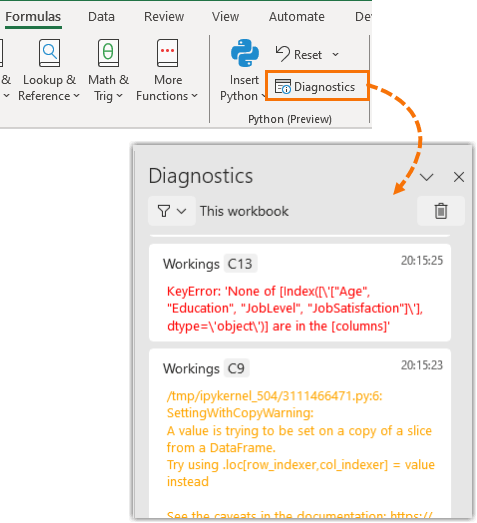
Or try asking ChatGPT or Bing Chat what’s wrong with your code.
Shortcuts
Everyone loves keyboard shortcuts and with Python comes some new ones you might find handy:
Python Mode | CTRL + ALT + SHIFT +
P | Opens the Python editor in the current cell for authoring Python formulae in the formula bar. |
Output Toggle | CTRL + ALT + SHIFT + M | Toggles between "Python Object" and "Excel Values" as the output type for Python formulae. |
Toggle Formula Bar
Size | CTRL + SHIFT + U | Expands or collapses the formula bar. |
Edit in Formula Bar | CTRL + F2 | Opens the selected cell for editing in the formula bar. If already editing, will toggle between cell and formula bar editor |
Edit Mode Toggle | F2 | Switches the editor’s mode between Enter, Edit, or Point. e.g. useful for switching between reference selection and editing. |
Commit Python Formula | CTRL + ENTER | Commits the current text as a Python Formula
to the cell. |