Excel functions are the backbone of a financial modeler’s day to day work and as such, it’s essential to have a good understanding of the functions that are commonly used to
build financial models.
Below are the top Excel functions that you must know as a financial modeler grouped by area.
Standard aggregating functions are fundamental to almost all Excel
work and are used to add up a range of numbers and find the total, minimum, maximum, average and count.
SUM
MIN
MAX
AVERAGE
COUNT
These functions all take a range or multiple cells/values as their arguments. Using the SUM function as an example, the syntax is:
=SUM(value1,value2)
or
=SUM(range1, range2)
Note: The syntax is the same for the other functions listed above.
Note: The syntax is the same for the
other functions listed above.
Logical Functions
Logical functions enable you to write ‘if’ statements where if one logical test is true, a calculation or value is returned, otherwise a different
calculation or result is returned.
They are handy for modeling different scenarios and outcomes based on a range of assumptions.
The functions and their syntax in this section are:
If you
get stuck, use our IF formula builder and have your IF formulas written for you.
Lookup Functions
Lookup functions are used to look up a value in another table and return a corresponding value from the same row.
They can be
used to create a reference table for financial modeling or bring data from one table into another.
For those with Excel 2021 or later, XLOOKUP should be your go-to lookup function. It overcomes the limitations of VLOOKUP and can do everything INDEX & MATCH can do.
If you have an earlier version of Excel, I encourage you to use INDEX & MATCH as an alternative to XLOOKUP.
Financial Functions
There are a ton of financial functions in Excel which make easy work of calculating common financial metrics.
The financial functions listed below are some of the functions you’ll most commonly use as a financial modeler:
PMT – Periodic Payment
PV – Present Value
NPV – Net Present Value
IRR – Internal Rate of
Return
Check out the video above for step-by-step examples of these functions.
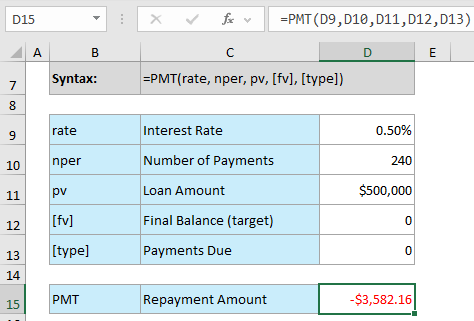
PMT Function
The PMT function is used to calculate the periodic payment for a loan or investment. It can be used to model
debt repayments or investment returns in a financial model.
Syntax:
PMT(rate, nper, pv, [fv], [type])
The rate argument is the rate per payment period.
The nper argument is the number of
payments made over the length of the loan. e.g. for a 20-year loan with monthly repayments there would be 240 payments
The pv argument is the principal or loan amount
The fv argument is optional. It represents the final balance of the loan or target. If omitted, zero is assumed.
The
type argument is optional. It represents when payments are due. 0 = end of period , 1 = beginning of period. If omitted, zero is assumed.
*Note:
results returned may differ from your bank, as there may be additional fees and taxes.
They may also calculate interest daily, or you may have an offset account etc.
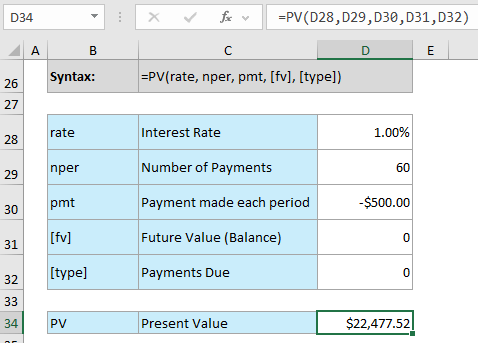
PV Function
The PV function calculates the present value of a future cash flow.
Syntax:
PV(rate, nper, pmt, [fv],
[type])
The rate argument is the rate per payment period.
The nper argument is the number of payments made over the length of the loan. e.g. for a 5-year loan with monthly repayments there would be 60 payments
The pmt argument represents the payment made each period and cannot change over the life of the annuity.
The fv argument is optional. It represents the future value, or a cash balance you want to attain after the last payment is made.
The type argument is optional. 0 = end of period
, 1 = beginning of period. If omitted, zero is assumed.
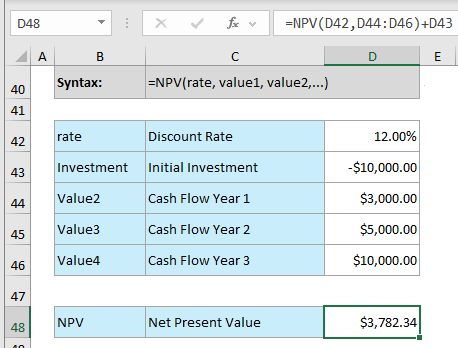
NPV Function
The NPV function is used to calculate the net present value of an investment based on a series of future cash
flows.
It is a key function for discounted cash flow (DCF) analysis.
NPV assumes cash flows occur at the end of each period and requires them to be equally spaced. If not, use XNPV function.
Syntax: NPV(rate, value1, value2,...)
The rate argument is the
rate of discount over the length of one period.
The value arguments represent the cash flows. Excel uses the order of value1, value2, ... to interpret the order of cash flows. Empty cells are ignored.
Note: if the initial investment occurs at the start of the investment period, do not include it in the vales as this should not be
discounted. Instead, add it on outside the formula, as shown below.
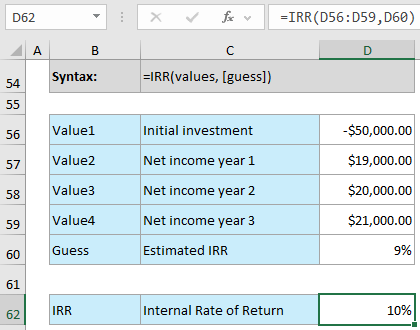
IRR Function
The IRR function is used to calculate the internal rate of return of an investment. It is another key
function for DCF analysis.
Syntax: IRR(values, [guess])
Values is an array or a reference to cells that contain numbers for which you want to calculate the internal rate of return. They must contain at least one positive and one negative value.
IRR uses the order of values to interpret the
order of cash flows. Therefore, you need to enter your payment and income values in the sequence you want.
The Guess argument is optional. It’s a number that you guess is close to the result of IRR. If omitted, it's assumed to be 10%.
Date Functions
Nearly all financial models are based on data over time. Below are few common date functions you’re likely to need:
EOMONTH(start_date, months) – returns the last day of the
month before or after a start date specified with a date serial number.
EDATE(start_date, months) – rolls a date serial number forward or back based on the number of months specified in the 'months' argument.
INTL(start_date, end_date, [weekend], [holidays]) - returns the number of whole workdays between two dates using parameters to indicate which and how many days are weekend days. Weekend days and any days that are specified as holidays are not considered as workdays.
These functions are just a starting point, and there are many other Excel functions that can be useful for financial modeling depending on the specific
needs of your project.
Dashboards provide insight, analysis and alerts by displaying key trends, comparisons and data in
interactive reports. The reader can filter data and change views to find answers to their questions and problems.Read More
Microsoft’s latest business intelligence (BI) & data visualization tool enables you to quickly develop stunning interactive dashboards. Embed Excel charts, tables, Pivot Tables and dashboards in your Power BI dashboards, then
securely share your dashboards to any device.Read More
Get quickly up to speed with Excel's functions. This course covers the fundamentals for each function, and less obvious uses for them. It's these more advanced techniques that will really set you apart from the crowd.Read More
Make huge efficiency gains by using dynamic named ranges to automatically update formulas, Pivot Tables and charts. Automate formatting like banded rows or columns; sorting and filtering; and totals and statistics. Everything you need to work with Tables in less than 1 hour.Read More
This short course will quickly have you building your own Pivot Tables with confidence. Start with the ideal data layout for creating Pivot Tables. Then move on to formatting, aggregation, pivot charts, filters, slicers and much more.Read More
Get data from almost any source (a database, the web, Excel, Sharepoint, Salesforce, OData etc), then clean, transform, merge and append data to your query. Load the data into Excel or Power Pivot for analysis, report preparation or export.Read More
Import millions of rows of data, create relationships between different data sources, and build interactive reports. Quickly transform huge volumes of data into meaningful information to get the answers you need.Read More
Designed to take you from zero to hero so you can confidently list 'Advanced Excel Skills' on your resume/CV. Starting with the essentials, then covering must-know skills like best workbook design, advanced formulas, pivot tables, conditional formatting, macros and much more.Read More
Learn the core concepts of the three primary financial statements : Income Statement, Balance Sheet and Cash Flow Statement. By understanding core concepts you can avoid common mistakes when working with these three statements. This course breaks down the modelling process into small segments that are easily digestible.Read More
Ideal for those involved in managing the daily operations of a business. Covering tasks such as calculating breakeven, optimizing shipping, allocating funds to maximize NPV/profit, or managing staff scheduling. Includes an introduction to Excel Solver and how to create Gantt Charts.Read More
Learning to use Pivot Tables will allow you to quickly summarise and analyse large amounts of data - with just a few clicks of your mouse. Quickly transform data into meaningful information, and create reports that are easy to update and change.Read More
Choose just one of these, or choose any combination of the three. Learn the core software tools any professional needs in a modern office environment.Read More
Use Excel's existing tools to make business decisions under uncertainty by performing Monte Carlo simulations, using Decision Trees and Forecasting with the Data Analysis Toolpak. Ideal for executives, analysts and all levels of business school students.Read More
Designed for professionals working in customer service or call center environments. Efficiently and accurately collect and analyze data. Create forecasts and generate clear, meaningful charts and reports. Boost your skills in handling customer service and call center information.Read More
Leverage Excel tools for financial analysis including Time value of Money functions, What-If analysis, Goal Seek, Amortization, Depreciation, and Solver Ideal for accountants, executives, analysts and all levels of business school students.Read More
Statistics for the non-statistician. Quickly and efficiently calculate and report the statistics of data and make decisions based on statistical output. Use the Excel Analysis Toolpak to generate descriptive statistics, histograms, correlations, regression, rank & percentile, random numbers, and sampling.Read More


 Check Out Our Courses