|
|
Automate Excel Everywhere - Windows PC, Mac & Excel
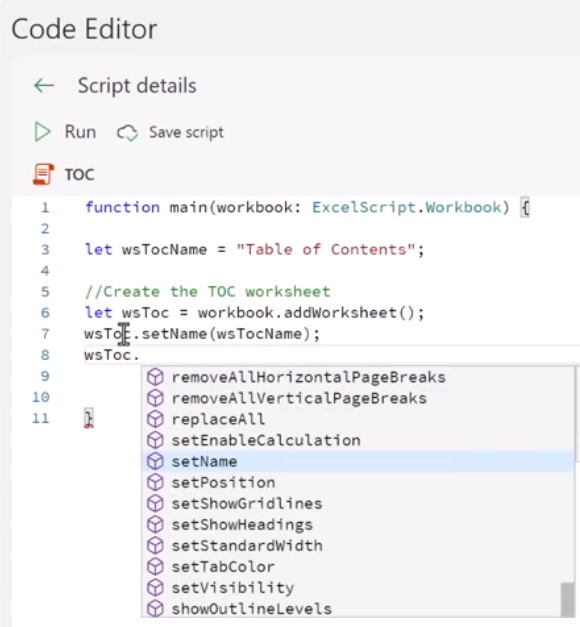
Online Office Scripts is a simple and intuitive programming language developed by Microsoft and designed specifically for non-programmers to automate their work. Whether you're using
Windows, Mac or Excel Online, Office Scripts empower you to streamline your workflow and reclaim countless hours spent on repetitive tasks. My friend and fellow Excel MVP, Mark Proctor, has developed the Office Scripts: Automate Excel Everywhere course. This course equips you
with the skills and knowledge to unlock the full potential of Office Scripts, enabling you to automate tasks and save valuable time. The great news is that this course currently has a special offer and is available for $127 USD (saving $100 USD on the standard price)
until Friday Sep 22nd. What can you expect to learn? - Master the fundamentals to understand and write efficient scripts
- Develop re-usable scripts to work with any spreadsheet
- Create simple applications for collecting and managing data through worksheet-based user interfaces
- Build self-running automation processes that operate in the background (you don't even need to click a button - it runs while you sleep!)
- With video lessons, hands-on exercises, and real-world examples, the course will equip you with practical skills that you can immediately apply in
your daily work.
- And remember, the course was designed with non-programmers in mind.
To learn more about the course, visit this page: >> Automate Excel Everywhere With Office Scripts <<
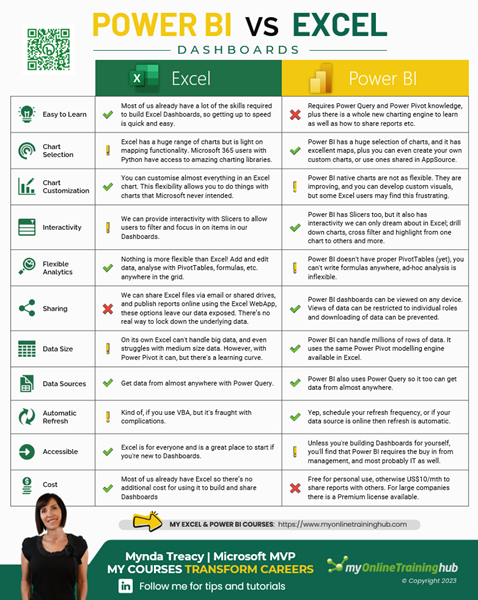
Excel Dashboards vs Power BI Dashboards
|
One of the most common questions I get is "Should I be using Power BI to build dashboards instead of Excel?" If the person you ask hasn't used both Power BI and Excel, you'll likely get a biased answer. But I've taught 1000's of people to build dashboards using both, so you can be assured I'll give a balanced view. I've created a table that summarizes the main differences, pros and cons of each. Download a copy so you can use it to make an informed decision on which tool suits you best.
|
Super Shortcut - Apply Percentage Format |
Apply percentage formatting by pressing CTRL SHIFT % This will display a number like 0.23 as 23%
|
Watch my detailed comparison of Excel and Power BI Dashboards.
|
Mynda Treacy Microsoft MVP Co-Founder My Online Training Hub
|
Excel DashboardsDashboards provide insight, analysis and alerts by displaying key trends, comparisons and data in interactive reports. The reader can filter data and change views to find answers to their questions and problems. Read More >
Power BIMicrosoft’s latest business intelligence (BI) & data visualization tool enables you to quickly develop stunning interactive dashboards. Embed Excel charts, tables, Pivot Tables and dashboards in your Power BI dashboards, then securely share your dashboards to any
device. Read More >
Advanced Excel FormulasGet quickly up to speed with Excel's functions. This course covers the fundamentals for each function, and less obvious uses for them. It's these more advanced techniques that will really set you apart from the crowd. Read More
>
Excel TablesMake huge efficiency gains by using dynamic named ranges to automatically update formulas, Pivot Tables and charts. Automate formatting like banded rows or columns; sorting and filtering; and totals and statistics. Everything you need to work with Tables in less than 1
hour. Read More >
Pivot Tables : Quick StartThis short course will quickly have you building your own Pivot Tables with confidence. Start with the ideal data layout for creating Pivot Tables. Then move on to formatting, aggregation, pivot charts, filters, slicers and much more. Read More >
Power QueryGet data from almost any source (a database, the web, Excel, Sharepoint, Salesforce, OData etc), then clean, transform, merge and append data to your query. Load the data into Excel or Power Pivot for analysis, report preparation or export. Read More >
Power Pivot & DAXImport millions of rows of data, create relationships between different data sources, and build interactive reports. Quickly transform huge volumes of data into meaningful information to get the answers you need. Read More >
Excel ExpertDesigned to take you from zero to hero so you can confidently list 'Advanced Excel Skills' on your resume/CV. Starting with the essentials, then covering must-know skills like best workbook design, advanced formulas, pivot tables, conditional formatting, macros and much
more. Read More >
Financial ModelingLearn the core concepts of the three primary financial statements : Income Statement, Balance Sheet and Cash Flow Statement. By understanding core concepts you can avoid common mistakes when working with these three statements. This course breaks down the modelling
process into small segments that are easily digestible. Read More >
Excel for Operations ManagementIdeal for those involved in managing the daily operations of a business. Covering tasks such as calculating breakeven, optimizing shipping, allocating funds to maximize NPV/profit, or managing staff scheduling. Includes an introduction to Excel Solver and how
to create Gantt Charts. Read More >
Excel VBAAre you tired of spending hours on tedious, manual tasks in Excel? Do you want to boost your productivity and take your skills to the next level? If you're nodding your head, then you're in the right place.
Learn Excel
VBA and save hours of time even if you have zero prior experience with programming. Read More >
Pivot TablesLearning to use Pivot Tables will allow you to quickly summarise and analyse large amounts of data - with just a few clicks of your mouse. Quickly transform data into meaningful information, and create reports that are easy to update and change. Read More >
Excel, Word & OutlookChoose just one of these, or choose any combination of the three. Learn the core software tools any professional needs in a modern office environment. Read More >
Excel for Decision MakingUse Excel's existing tools to make business decisions under uncertainty by performing Monte Carlo simulations, using Decision Trees and Forecasting with the Data Analysis Toolpak. Ideal for executives, analysts and all levels of business school
students. Read More >
Excel for Customer ServiceDesigned for professionals working in customer service or call center environments. Efficiently and accurately collect and analyze data. Create forecasts and generate clear, meaningful charts and reports. Boost your skills in handling customer service and call
center information. Read More >
Excel for FinanceLeverage Excel tools for financial analysis including Time value of Money functions, What-If analysis, Goal Seek, Amortization, Depreciation, and Solver Ideal for accountants, executives, analysts and all levels of business school students. Read More >
Excel Analysis ToolPakStatistics for the non-statistician. Quickly and efficiently calculate and report the statistics of data and make decisions based on statistical output. Use the Excel Analysis Toolpak to generate descriptive statistics, histograms, correlations, regression, rank &
percentile, random numbers, and sampling. Read More >
This email may contain affiliate links. This means I may earn a commission should you choose to make a purchase using my link. But we only promote courses we believe will benefit you. |
|
|
|
|
|