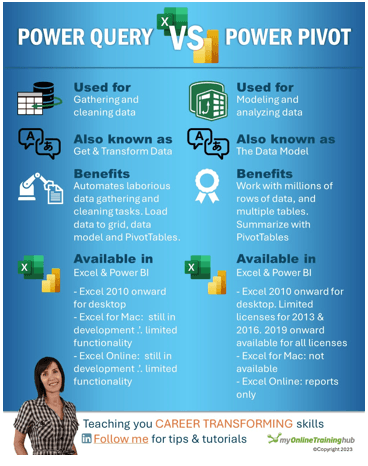
Power Query vs Power PivotWhat is Power Query? What is Power Pivot? What's the difference between them? How can they make your life better? Click the button below to read more and download a full size, hi-res copy of our PQ v PP Infographic. If you want a structured approach to learning Power Query and Power
Pivot, consider our comprehensive courses. Learn skills that will change your life. |
Power Query vs Power Pivot - in video form! It's like Barbenheimer, but less pink and with less blowing stuff up. You can still grab some popcorn though. |
Super Shortcut - Hide Rows |
Select the rows then press CTRL 9 to hide them. SHIFT CTRL 9 to unhide You need to use 9 on the main keyboard, not the numeric keypad. |
Mynda Treacy Microsoft MVP Co-Founder My Online Training Hub |
Excel DashboardsDashboards provide insight, analysis and alerts by displaying key trends, comparisons and data in interactive reports. The reader can filter data and change views
to find answers to their questions and problems. Power BIMicrosoft’s latest business intelligence (BI) & data visualization tool enables you to quickly develop stunning interactive dashboards, and securely share your
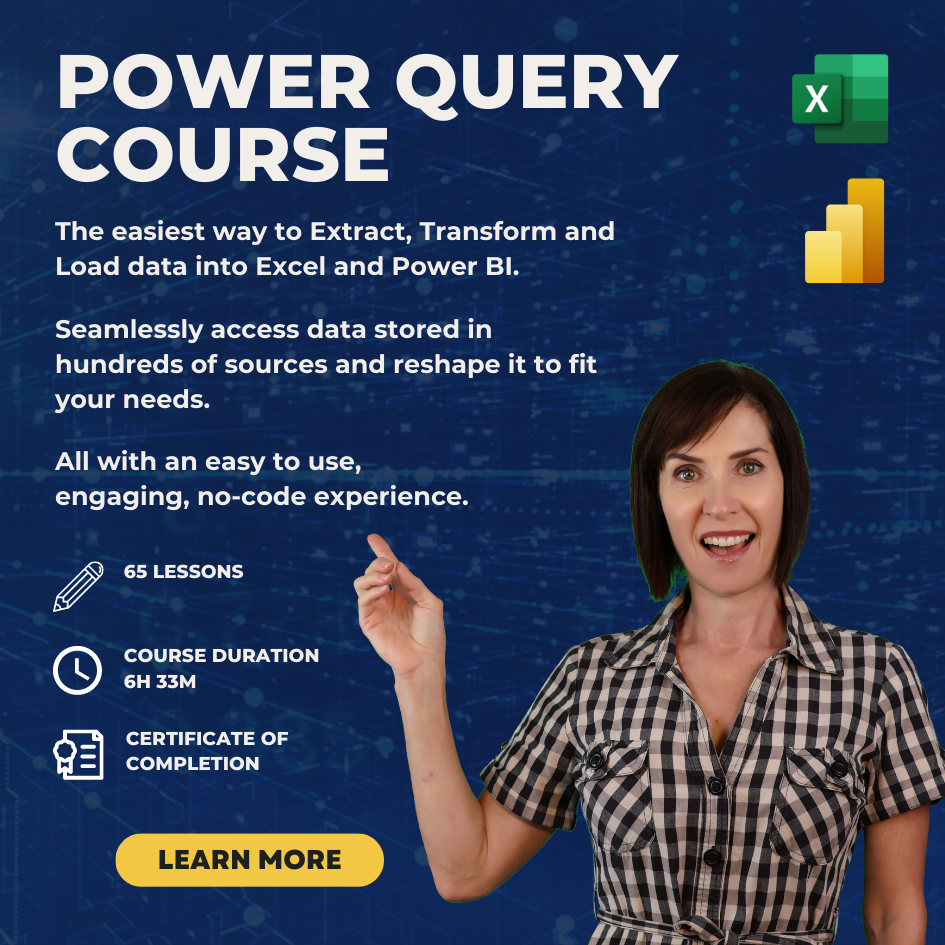
dashboards to any device. Read More... Power QueryGet data from almost any source (a database, the web, Excel, Sharepoint, Salesforce, OData etc), then clean, transform, merge and append data to your query. Load
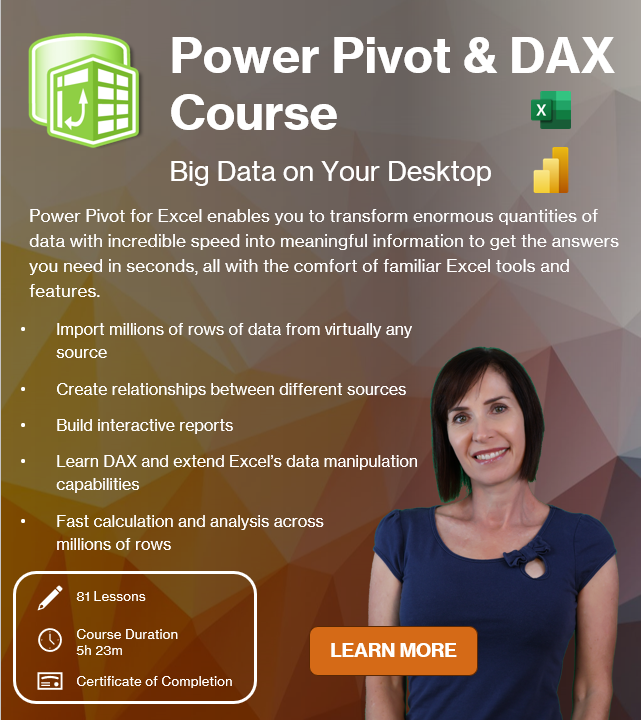
the data into Excel or Power Pivot for analysis, report preparation or export. Read More... Import millions of rows of data, create relationships between different data sources, and build interactive reports. Quickly transform huge volumes of data into
meaningful information to get the answers you need. Advanced Excel FormulasGet quickly up to speed with Excel's functions. This course covers the fundamentals for each function, and less obvious uses for them. It's these more
advanced techniques that will really set you apart from the crowd. Read More... Excel TablesMake huge efficiency gains using dynamic named ranges to automatically update formulas, Pivot Tables and charts. Automate formatting like banded rows or columns;
sorting and filtering; totals and statistics. Read More... Pivot Tables : Quick StartThis short course will quickly have you building your own Pivot Tables with confidence. Start with the ideal data layout for creating Pivot Tables. Then move on to
formatting, aggregation, pivot charts, filters, slicers and much more. Read More... Excel ExpertDesigned to take you from zero to hero so you can list 'Advanced Excel Skills' on your resume/CV. Starting with the essentials, then covering must-know skills like
best workbook design, advanced formulas, pivot tables, conditional formatting, macros and more. Read
More... Financial ModellingLearn the core concepts of the three primary financial statements : Income Statement, Balance Sheet and Cash Flow Statement. By understanding core concepts you can
avoid common mistakes. This course breaks down the modelling process into small segments that are easily digestible. Read
More... Excel for Operations ManagementIdeal for those involved in managing daily operations in a business. Covers tasks such as calculating breakeven, optimizing shipping, allocating
funds to maximize NPV/profit, or managing staff scheduling. Includes an introduction to Excel Solver and Gantt Charts. Read More... Excel Pivot TablesLearning to use Pivot Tables will allow you to quickly summarize and analyze large amounts of data - with just a few clicks of your mouse. Quickly transform data
into meaningful information, and create reports that are easy to update and change. Read More... Excel, Word, OutlookChoose just one of these or choose any combination of the three. Learn the core software tools any professional needs in a modern office
environment. Read More... Excel for Decision MakingUse Excel's existing tools to make business decisions under uncertainty by performing Monte Carlo simulations, using Decision Trees and Forecasting with the Data
Analysis Toolpak. Ideal for executives, analysts and all levels of business school students. Read
More... Excel for Customer ServiceDesigned for professionals working in customer service or call center environments. Efficiently and accurately collect and analyze data. Create forecasts and
generate clear, meaningful charts and reports. Boost your skills in handling customer service and call center information. Read More... Excel for FinanceLeverage Excel tools for financial analysis including Time value of Money functions, What-If analysis, Goal Seek, Amortization, Depreciation, and
Solver. Ideal for accountants, executives, analysts and all levels of business school students. Read More... Excel Analysis ToolpakStatistics for the non-statistician. Quickly and efficiently calculate and report the statistics of data and make decisions based on statistical output. Use the
Excel Analysis Toolpak to generate descriptive statistics, histograms, correlations, regression, rank & percentile, random numbers, and sampling. Read More... |
|