Download the Workbook
The workbook contains examples of everything in this post, along with screenshots and notes so you can use it as a reference guide or share it with co-workers.
Highlight Duplicates with Conditional Formatting
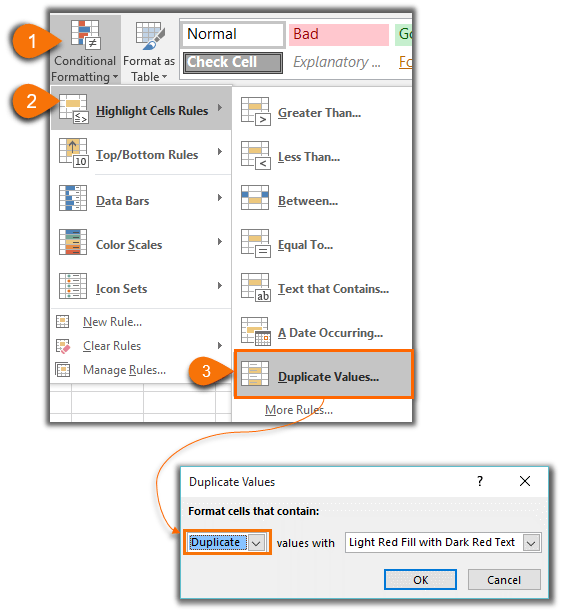
Conditional Formatting can quickly highlight duplicates in a column. Simply select the column or columns of cells containing the suspected duplicates > Home tab > Conditional Formatting > Highlight Cells Rules > Duplicate Values:
Tip:
You can change the format by clicking the drop down for ‘Values with’ (see image above).
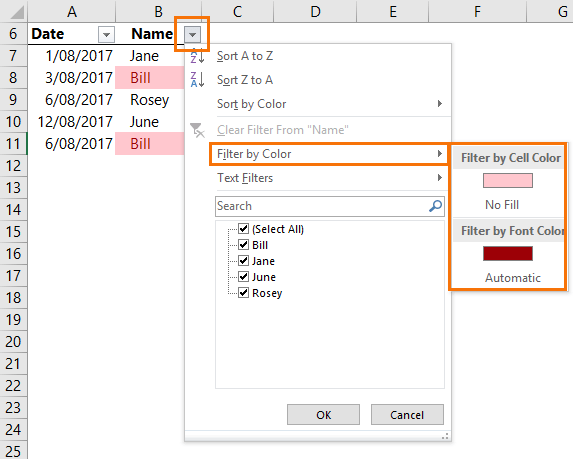
Once the formatting is applied you can use filters (Data tab > Filters), based on the cell fill color or font color to display or hide the duplicate values:
Pros: Great for visually highlighting duplicates in a column while retaining them in the dataset. You can use filters to hide
duplicates or focus on them.
Cons: Duplicates remain in the dataset, and that may be exactly what you want, but if you just want to get rid of them, then keep reading.
This method also doesn’t highlight the row and only identifies duplicates in a single column.
Identify Duplicates with a
Formula
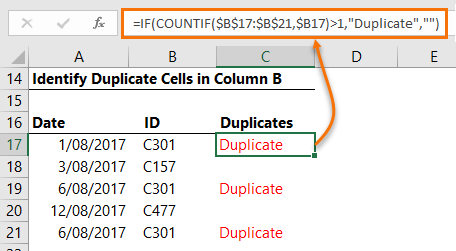
You can add a column to your data table to tag rows containing duplicates. The formula below is looking for duplicate rows, i.e. where both the Date and ID values are duplicated:
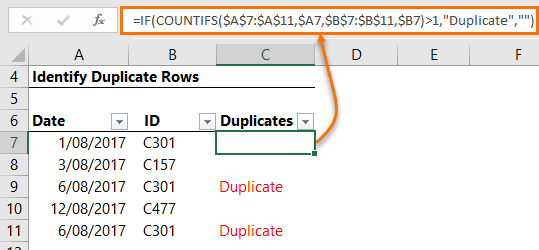
The formula in cell C7:
=IF(COUNTIFS($A$7:$A$11,$A7,$B$7:$B$11,$B7)>1,"Duplicate","")
uses COUNTIFS to check both the Date and ID columns are the same, if the count is greater than 1, then ‘Duplicate’ is returned, otherwise the cell is left blank.
Tip: If you only want to check a single column, let’s say the ID column, then you could use the COUNTIF function like so:
Pros: Column containing duplicate tag can be used in PivotTables or other formulas to ignore or focus on duplicate
rows.
Cons: Formula can be difficult to remember. Requires an extra column in your dataset. Could be cumbersome in large files.
Identify Duplicates with
PivotTables
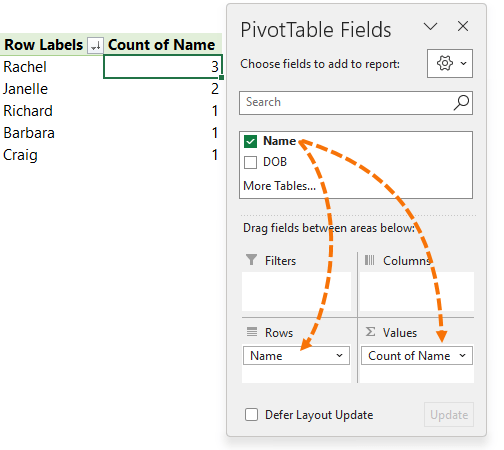
A PivotTable is an excellent way to quickly identify if you have any duplicates in a column.
Place the field you want to check for duplicates in both the Rows and Values areas, in my case it’s the
Name field. The PivotTable gives you a list of unique names and the count:
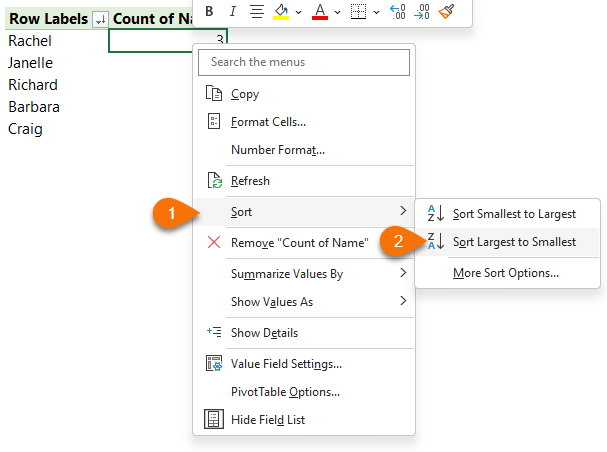
Tips: sort the PivotTable Count column in descending order to bring the duplicates to the top; right-click a cell in the values area > Sort > Sort Largest to Smallest:
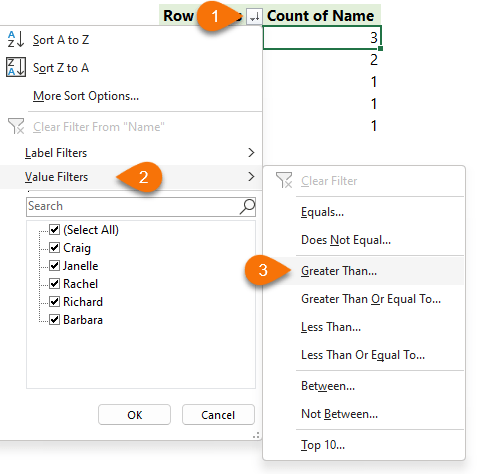
Or filter the Count column to only show records greater than 1:
Pros: Quick and easy to do and great for large datasets because you can sort the count in descending order
to bring any duplicates to the top, or filter to only show duplicates. The PivotTable also provides the count of an item so you can see how many times it is duplicated.
Cons: Doesn’t remove duplicates, only highlights them.
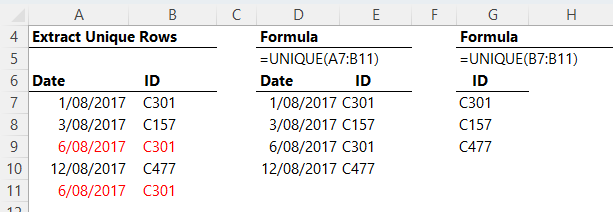
Extract Unique Values
If you want to retain the original data as it is,
Microsoft 365 users and those with Office 2021 onward can use the UNIQUE function to extract a distinct list from multiple columns.
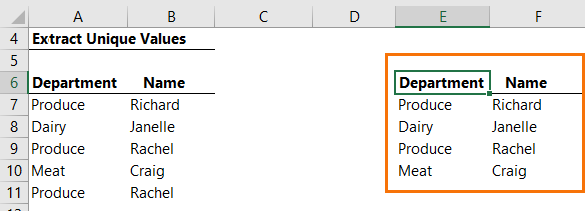
It’s super easy to use, simply reference the column or columns you want to extract data from. The UNIQUE function spills the
results.
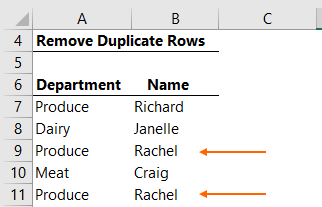
Remove Duplicate Values
We’ve looked at highlighting, extracting and tagging cells or rows containing duplicates, but sometimes you want to remove duplicates from the original data set, so all you're left with is a unique list of values. There are a couple of ways to tackle this.
Let’s say we want to remove duplicate rows from the table below i.e. we want to retain row 7 with ‘Produce’ and ‘Richard’, but we want to remove
one of the duplicate rows (9 or 11) containing ‘Produce’ and ‘Rachel’:
We can use the Remove Duplicates tool on the Data tab of the ribbon:
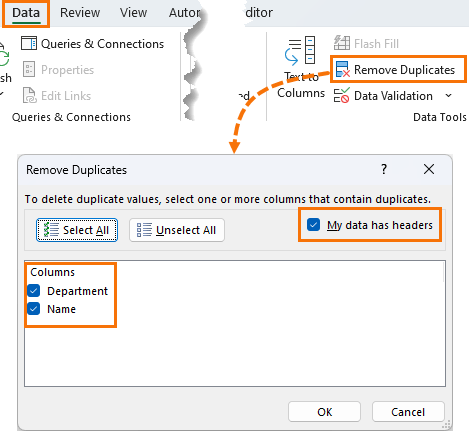
By selecting both the Department and Name columns I’m telling Excel that I want it to find duplicates where the values in both columns are the same. Note that I also have the ‘My data has headers’ box checked so it ignores my headers.
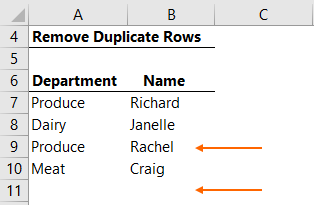
And I’m left with a list of unique rows:
Pros: Quick and easy to use.
Cons: Removal of duplicates is permanent. If your data gets updated then you need to run the Remove Duplicates process again.
Power Query Remove Duplicates
Power Query (available in Excel 2010 onwards), also has a Remove Duplicates tool.
Format your data in an Excel Table then load the data into Power Query:
Excel 2010 & 2013: Power Query tab > From Table:
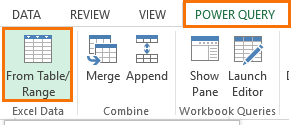
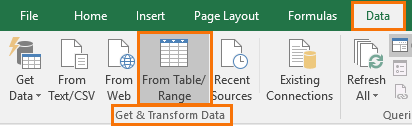
Excel 2016 onward: Data tab > Get & Transform group: From Table:
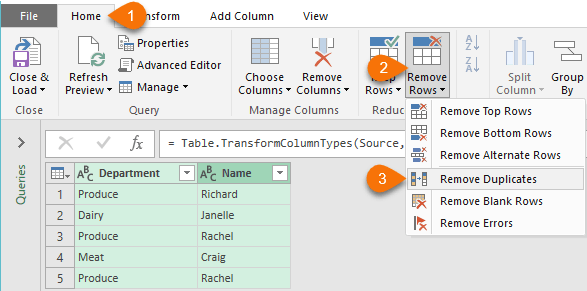
This will load the data into
Power Query and open the Power Query Editor window. In the Power Query Editor simply select the columns you want it to find duplicates for (hold Ctrl to select multiple columns, or Shift to select contiguous columns) > Home tab > Remove Rows > Remove Duplicates:
Pros: The great thing about using Power Query is if your source data gets updated you can Refresh the query and it will remove duplicates again, with just the
click of a button. Original data remains intact, plus you have a new view of the data that excludes the duplicates.
Cons: Requires a few more steps than the previous example. Retaining original data may make the file unnecessarily large. If so, the original data can be stored in a separate file.
*Versions of Excel supporting Power Query. Excel 2010/2013 users download Power Query
here.
Remove Duplicates with Advanced Filter
Advanced Filter can extract a list of unique items from a column or columns. First select the data, then Data tab > Advanced:
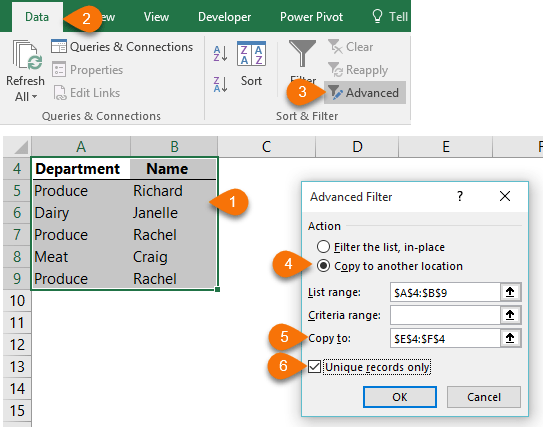
In the Advanced filter dialog box (image above) choose to copy the list to another location (4 & 5), and check the box for ‘Unique records only’. And voila, we
now have two lists, the original, and the list excluding duplicates in columns E & F:
Pros: Reasonably easy to use. Also has an option to just filter the list to hide duplicates. Can handle multiple columns of data.
Cons: No link is maintained between the original data and the filtered data. If the original data gets updated then the Advanced Filter must be run
again.
So, there you have 7 ways to identify or remove duplicates. Depending on my needs I like to use Power Query to remove duplicates, Conditional Formatting to visually indicate duplicate records and PivotTables to identify if large datasets contain duplicates.
Related Lessons
Tutorials:
Courses:


 Check Out Our Courses