Hi ,
Before we get into this week's blog post on Linear Regression, I want to let you know that we are having a 20% Off Sale on all our courses, until May 18th.
Click the image below to
see our course list.
If you are an existing or past student, you can renew or upgrade your courses for 20% off too.
Just login to your account and click the UPGRADE or RENEW buttons beside your courses.

Linear Regression in Excel
Linear regression is easy with Excel's built-in tools. In this tutorial, we'll explore what linear regression is, why it's useful, and the tools that enable you to do it with the click of a few buttons.
Table of Contents |
- Video - Excel Linear Regression
- Download the Workbook
- What is Linear Regression and its uses?
- How to Perform Linear Regression in Excel
- Linear Regression with Charts
- Linear Regression with the Data Analysis Toolpak
- Interpreting the Results of Linear Regression in Excel
|
Watch the Video

Download the
Excel Workbook

Download the Excel workbook containing examples of linear regression. NOTE: Make sure your browser saves this as a .xlsx file, not a .zip file. |
What is Linear Regression and its uses?
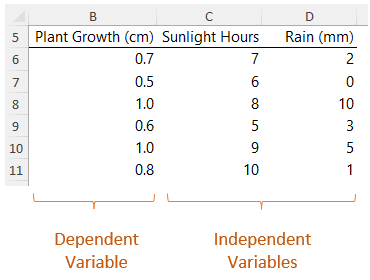
Let's start with an example. Below I have some data on plant growth, how many hours sunlight it gets per day and how much rain. One way we can understand how sunlight and rain contribute to growth, is to use linear regression.
Linear regression is a statistical method used to model the relationship between a dependent variable and one
or more independent variables.
It is useful because it allows us to identify the relationship between two variables and make predictions based on that relationship. It is commonly used in fields
such as finance, economics, and science to make predictions and inform decision-making.
How to Perform Linear Regression in Excel
Excel has built-in functions and tools that make it easy to perform linear regression. In preparation we need to organize the data into a table.
Excel Linear Regression with Charts
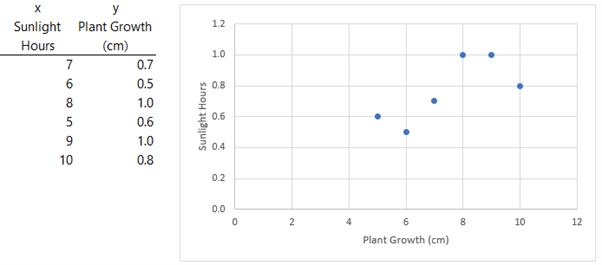
If
you only have one independent variable, let’s say sunlight hours, you can use charts to model linear regression. Start with the independent variable in the first column, then the dependent variable in the next column so they are plotted on the X and Y axis respectively. Insert a scatter chart:
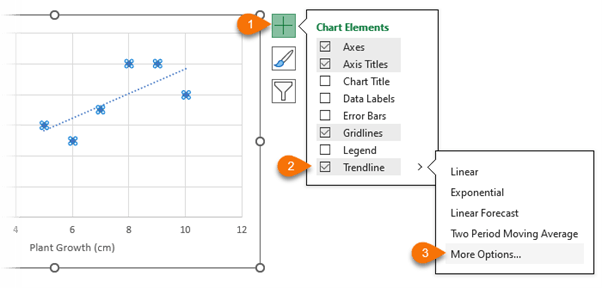
Add a Trendline and go into the more options to open the Trendline formatting pane:
The Linear trendline (1) should be selected by default. You can also choose to display the equation (2) and R-squared value (3) on the chart:
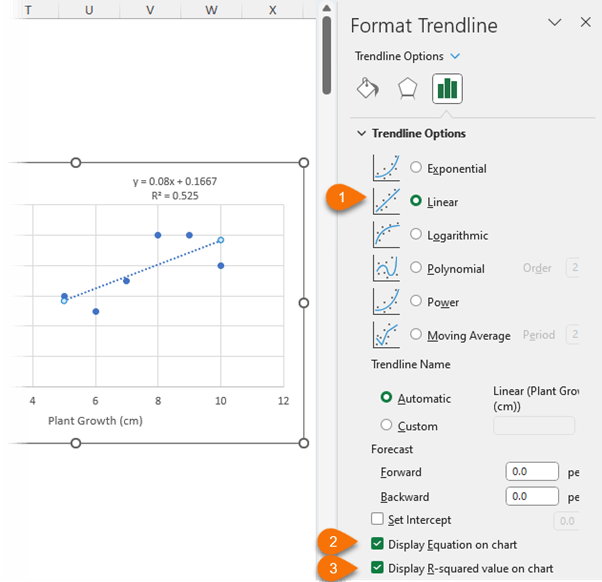
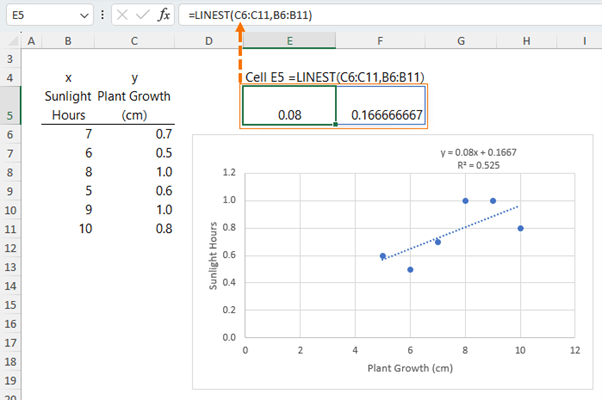
The equation y=0.08x + 0.1667 represents a straight line that shows the relationship between two variables. "y" (growth cm) is the dependent variable, which changes based on the value of the independent variable "x" (sunlight hours). The equation can be used to predict or forecast the growth, "y", for a given value of sunlight, "x".
The coefficient 0.08 is the slope
of the line, which represents the rate at which the value of "y" changes for every unit increase in the value of "x". In this case, the slope indicates that for every one hour increase in sunlight, "x", the plant growth (cm), "y" is expected to increase by 0.08 cm.
The intercept 0.1667 represents the value of "y" when "x" is equal to zero. In other words, it is the value of "y" when there is no "x" effect. In this case, the intercept indicates that the
growth is expected to be 0.1667 when sunlight hours are equal to zero.
To use this equation to make predictions, you would simply substitute the value of "x" into the equation and solve for the value of "y". For example, if "x" (sunlight hours) is equal to 5, the predicted value of "y" (growth cm) would be:
y = 0.08*5 + 0.1667
y = 0.4 + 0.1667
y
= 0.5667
The equation can also be generated using the LINEST function which takes the following arguments:
=LINEST( known_ys, [known_xs], [const], [stats])
Note: Arguments in square brackets are optional.
We can see in cell E5 below, LINEST returns the coefficient 0.08 and the intercept 0.1666'.
The R Squared value, also known as the coefficient of determination, is a statistical measure that explains the strength of the relationship of a linear regression model. It is a
number between 0 and 1, where 0 indicates that the model does not fit the data at all, and 1 indicates that the model perfectly fits the data.
To put it simply, the R-squared value tells us how much of the variation in the dependent variable (the outcome being predicted) can be explained by the independent variable(s) used in the linear regression model. In this example 52.5% of the plant's growth is as a result of the sunlight hours.
A high R-squared value indicates that the independent variable(s) have a strong relationship with the dependent variable and are able to explain a large proportion of its variation.
Therefore, the R-squared value helps us evaluate how well a linear regression model can predict the outcome variable based on the independent variable(s) used in the model. It is an important metric to consider when interpreting the results of a linear
regression analysis.
Excel Linear Regression with Data Analysis Toolpak
We can also perform regression analysis with the Data Analysis Toolpak which can handle multiple independent variables. For example, we could model the effect of sunlight and rain on plant growth.
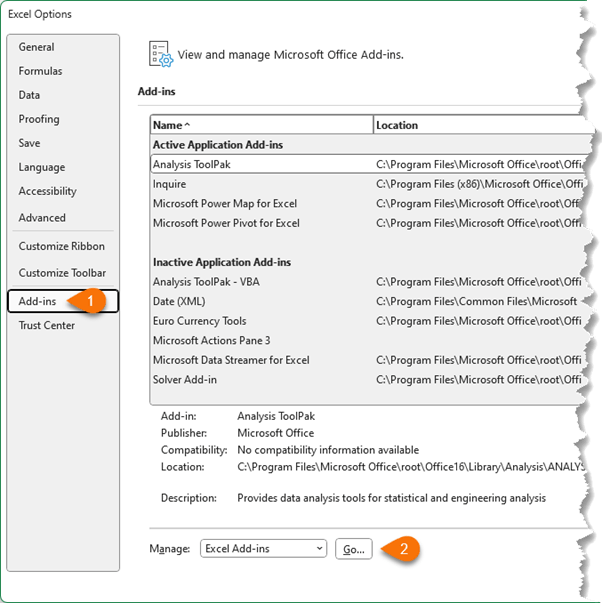
The
Data Analysis Toolpak is a free add-in available in Excel. Enable it via the File tab > Options > Add-ins > click Go beside the Manage drop down list:
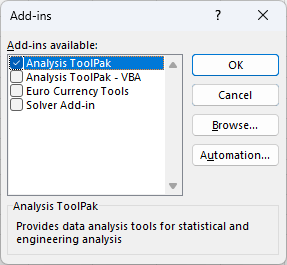
Select Analysis Toolpak from the list:
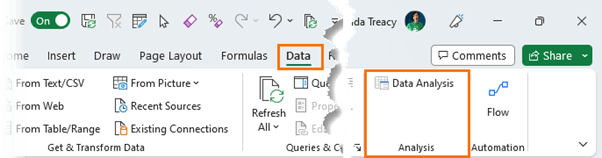
You'll now have access to it from the Data tab of the Ribbon:
Set up the data so that the independent variables are side by side:
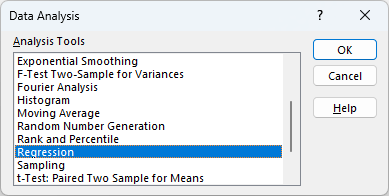
Then on the Data tab > Data Analysis > Choose Regression from the list >
The Y input range is the dependent variable, and the X input range are the independent variables:
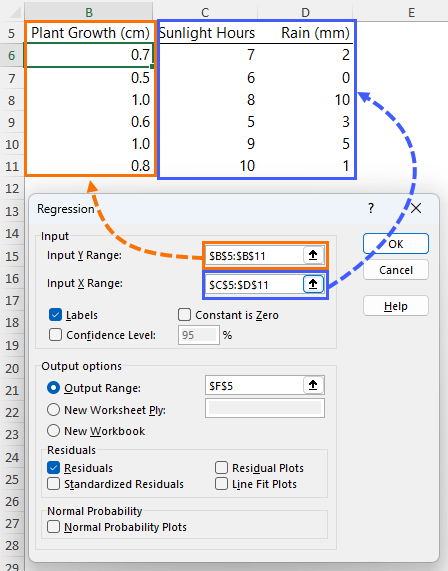
I have checked the box for Labels because I included the column headers in the input ranges. The Output range is the cell where the summary is going to be placed. And I've included the Residuals in the analysis.
Interpreting the Results of Linear Regression in Excel
After clicking OK in the Regression dialog box
above, the following tables are returned:
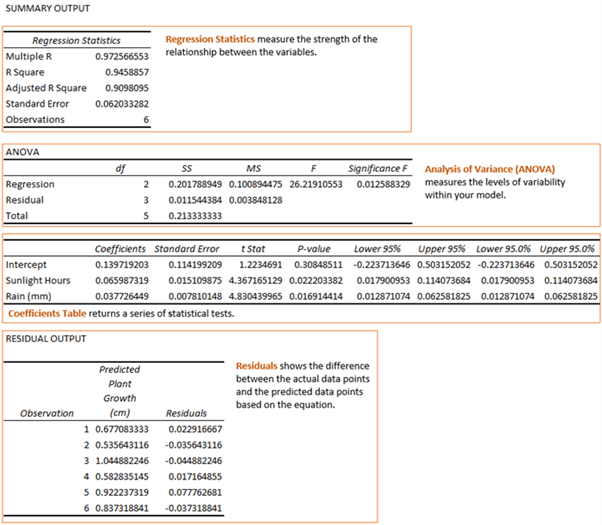
R Square
We can see from the data above that the relationship between the variables is
strong. The R Square value tells us that 94.6% of the growth is as a result of sunlight hours and rain.
Standard Error
The Standard Error tells us how wrong the model is on average. The lower the value the better. In this example we know that the standard distance between the predicted growth and the actual growth is 0.06cm bigger or smaller.
Analysis of Variance (ANOVA)
This table measures the levels of
variability within your model.
Coefficients Table
This table returns a series of statistical tests. We can see that both sunlight hours and rain have a positive association with growth and that for every sunlight hour the plant will grow 0.066 cm and for every 1mm of water it will grow 0.038 cm.
Residual Output
Residuals shows the difference between the actual data points and the predicted data points
based on the equation. We know from the chart example earlier that in this example the equation is y = 0.08x + 0.1667.
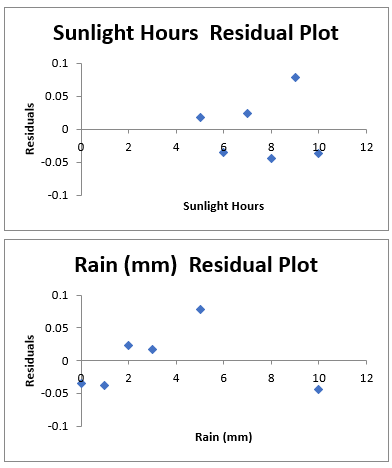
They illustrate how well your model fits the data. Ideally the residuals should be scattered around zero. A quick way to visualize them is by checking the box to include Residual Plots in the Regression dialog box.
For more detailed explanation of Excel Regression analysis, check out StatisticsByJim.
Have a great day,
Mynda Treacy
Co-founder My Online Training Hub


 Check Out Our Courses