Hi ,
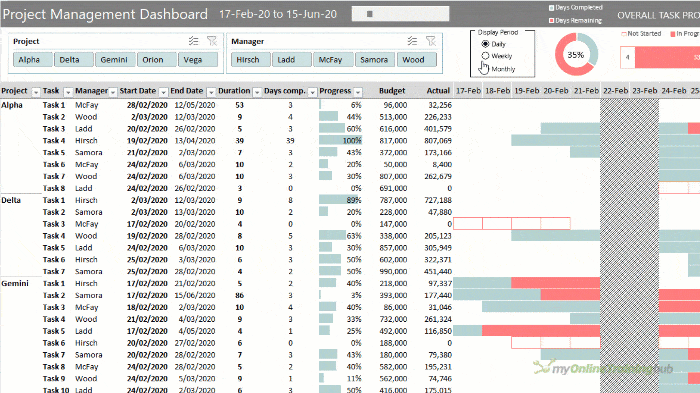
Project Management Dashboard With Dynamic Periods
One of my most popular tutorials has been my Excel Project Management dashboard with nearly 2M views to date.
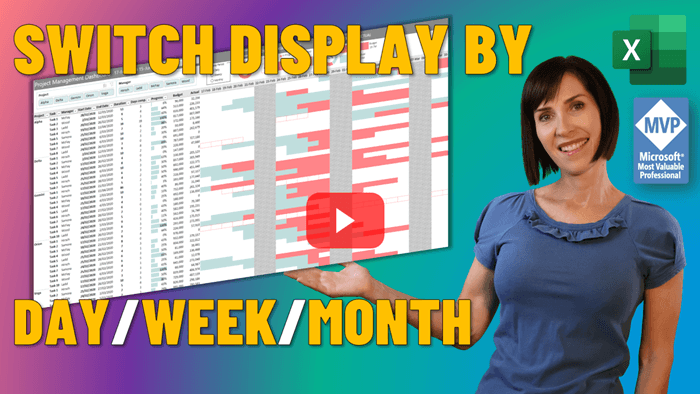
However, I often get asked if there’s a way to switch between viewing the projects by day, week or month. The answer is yes and, in this tutorial I’m going to show you how we can use some old-fashioned form control buttons to create an interactive way to change
the period grouping.
Note: you can also use this tutorial to find the formulas required if you only want to view the progress by week or month, without toggling from one to the other.
Note: requires Office 2021 or later, or Microsoft 365.
Watch the Video
Download the Example Excel File
Download the workbook. Note: This is a
.xlsx file. Please ensure your browser doesn't change the file extension on download. |
Building the Dashboard Step by Step
I’m going to start this tutorial by modifying the original project management dashboard. If you’d
like to get up to speed, complete up to the 25:20 mark in the original video.
The written instructions below are supplemented by the videos for this tutorial. If anything isn’t clear, please refer to the videos where you’ll see more detailed explanation and you can see exactly what I do to build the dashboard.
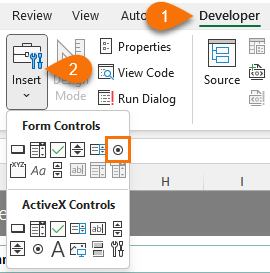
Radio Button Form Controls
Radio buttons are found on the Developer tab of the ribbon. If you don’t see
it, click here: How to enable the developer tab in Excel.
I want the radio buttons to be single select, so I start by inserting a group box to store them in:
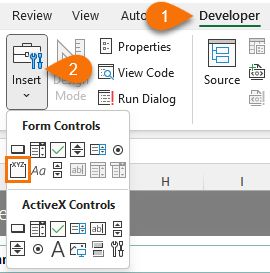
Left click & drag to draw the box where you want the buttons. Then insert the radio buttons:
IMPORTANT: the radio button form control must be fully enclosed by the
group box, otherwise it will not be single select.
Right click the form controls > Edit text to rename them.
Link the form controls to a cell in the workbook: right click the form controls > Format control > cell Link: preferably choose a cell out of sight of the dashboard. Mine is in cell R2 on the ‘Workings’ sheet. I’ve named this cell ‘DisplayPeriod’ and I’ll be
using this in the formulas for the dashboard.
Each button returns a unique number (1, 2 or 3) which we can use to identify which button is selected.
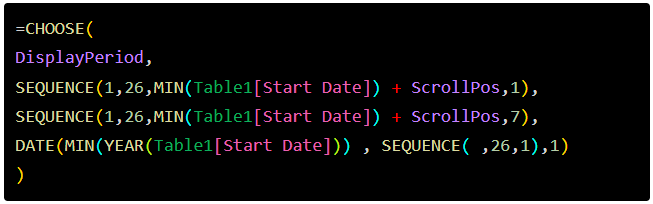
Formula for Days, Weeks and Months Timeline
We need 3 different formulas: one to return a list of 26 days, one to return a list of 26 weeks and one to return a list of 26 months (you
can specify a different number of days, weeks or months).
We can use the CHOOSE function or the SWITCH function to select the correct formula based on the radio
button selected. I’m going to use the CHOOSE function.
Each formula also uses the SEQUENCE function to return the dates. This is a dynamic array function available
in Excel 2021 onward and Microsoft 365.
Let’s look at the individual formulas and then we’ll bring them together with CHOOSE and link them to the radio buttons.
Days Formula

In English, SEQUENCE returns an array of 26 numbers across the columns, starting with the
earliest Start Date in Table 1, plus the scroll bar position, and incrementing by 1.
Weeks Formula

As above, except incrementing by 7 days at a time.
Months Formula

Use the DATE function to create a date by finding the earliest Year in the Start Date column of Table1, with SEQUENCE returning an array of month numbers from 1 to 26*, for the 1st of each month.
*The DATE function returns a date. The syntax
is:

Now I know there can’t be month numbers greater than 12, but when you give the DATE function a month number of 18, for example, it interprets it as 1.5 years. Therefore, this formula:

Returns 1st June, 2021.
Tip: change 26 in the formula to return more or less dates.
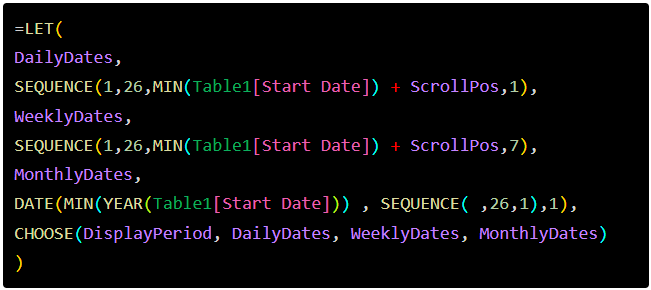
Now we need to bring the formulas together and link them to the radio buttons. I can use the CHOOSE function to identify which period is selected in the radio button like so:
Of course, if you come back to this formula in the coming months or years, it’s going to take some time to figure out what it’s doing, so I’ll use the LET function to make it clearer:
Conditional Formatting
For
this dashboard we’re using formulas that evaluate to TRUE or FALSE to specify when conditional formatting is applied.
For more click here: Conditional Formatting with Formulas.
There are five different formats for the Gantt chart section of the
dashboard:
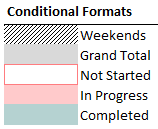
The last tree conditional formats listed above require three different rules for each format, one for the days, one for the weeks and one for the months. Let’s start with the easy formats for the weekends and grand total:
Weekend
conditional format formula

The formula above checks if the ‘Daily’ radio button is selected, if it is AND the weekday in row 5 (where Monday is 1 and Sunday is 7) is > 5 and the task cell is not blank it will return TRUE, otherwise it will return FALSE.
More on the WEEKDAY function here.
Grand Total conditional format formula

The formula above simply checks if the text ‘Grand Total’ is in column A.
The next formulas use the LET function because of their complexity. Each cell in these formulas have been named in the LET, which allows you to more easily follow the different formulas for the DaysFormat, WeeksFormat and MonthsFormat.
Again, we use CHOOSE to select the relevant formula based on the radio button selected.
See the video for this lesson for an explanation of how these
formulas work.
Not Started formula
The ‘Not Started’ formula checks if the progress is zero AND the start and end dates fall within the current period. I’ve used the LET function again to make these formulas easier to write and follow.
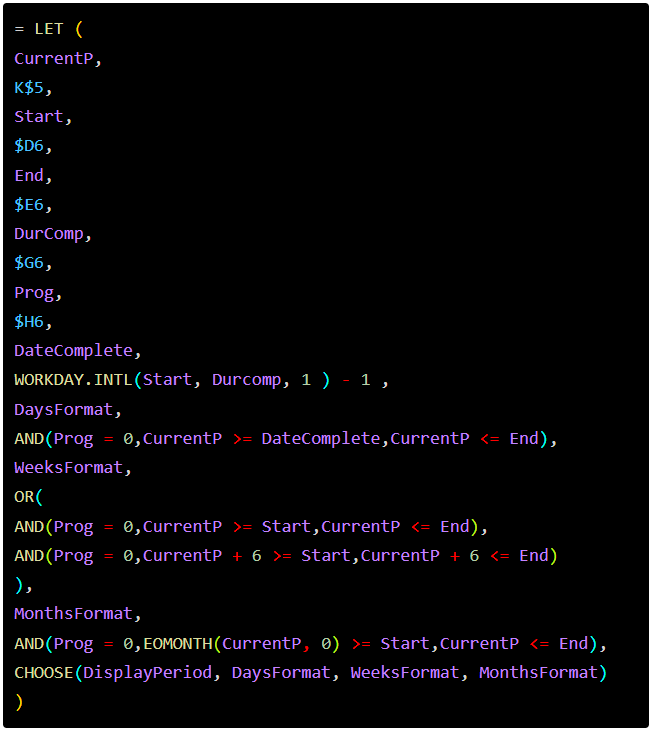
More on the functions used in
this formula:
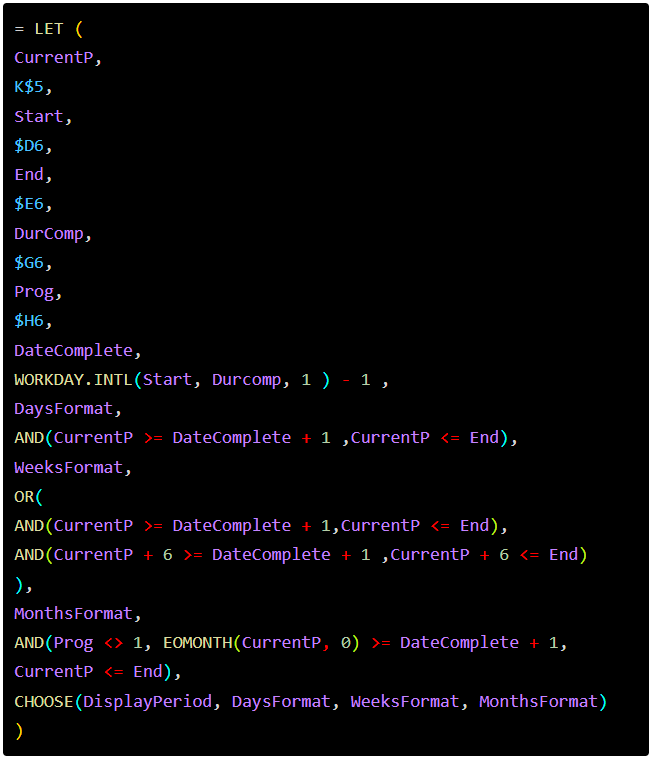
In Progress formula
The ‘In Progress’ formula checks that
the progress is not 100% complete, AND the current period is >= the date of work completed so far, and the current period is <= to the end date.
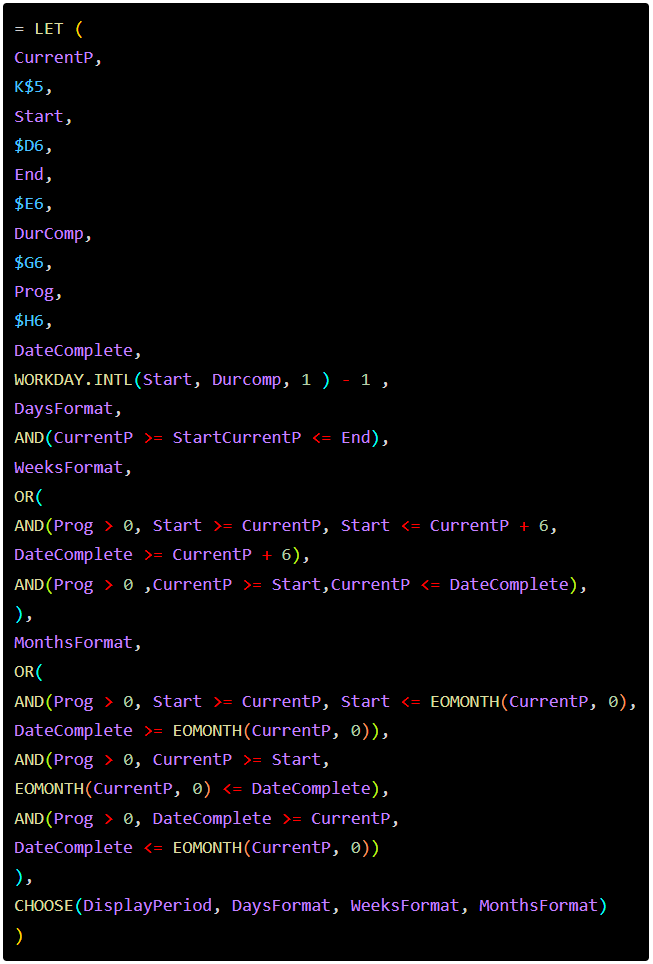
Completed Progress formula
The ‘Completed Progress’ formula checks that progress is > 0 AND the start date and the date of work completed so far is
within the current period. OR the start date is less than the current period and the date of work completed so far is greater than the current period dates.
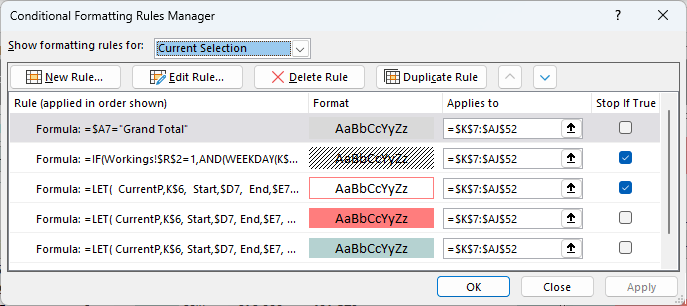
The order of the conditional formats and ‘Stop if True’ settings are also important, as shown below:
Quick Tip : 3 List Date Tricks That Don't Seem Possible
Surprise your co-workers: create lists of dates with the DATE function and this SEQUENCE trick!

You can also watch this tip on our social media channels:


Have a great day,
Mynda Treacy
Co-founder My Online Training Hub


 Check Out Our Courses